Detect the changes in Occupancy, ADR and Booked Nights, compare the trends to past and future patterns.
5. Pacing
The pacing dashboard shows the future reservation insights of the booking trends in your destination. The dashboard is incorporated to help you estimate the daily, weekly and monthly evolution of Occupancy, ADR and Booked Nights in the dates leading up to a specific date and/or compared to up to 3 years prior. The pacing trends show how occupied your market is on each day in the upcoming calendar year, the average ADR (in USD) for the next 365 days and finally the number of booked nights. You can compare each of these KPIs against themselves for a specific date not only for future but past data with more granular analysis (monthly, weekly, daily).
As mentioned before, there are three main KPIs that help you establish the future trends of your short-term rental market:
Pacing Occupancy - For each selected date, you can compare the past and future occupancy up to a selected date. This means that you can easily measure on a historical basis to what degree your competitive set was booked, for the entire recent year leading up to date, and then compare that evolution with future occupancy and three years prior.
Pacing ADR - The next feature is the average ADR (in USD) that your competitive market was booked at for the next 365 days, which will help you to target specific calendar dates in each season. Unlike the ADR graph in Rate and Demand, which shows the average of advertised rates, this graph provides a new dimension of analysis by revealing the conversion of competitive listings on each date it was previously available.
Pacing Nights Booked - The Count of Reservations graph features the same functionality of the Pacing Trends graph, however, we are comparing the hard number of reservations recorded for a specific upcoming date across the same intervals for 1 year ago, 2 years ago and 3 years ago.
5.1. Pacing Charts
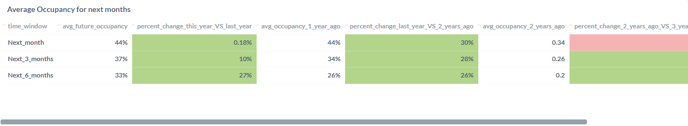
The first tables display the monthly analysis of the market. You can compare the future Occupancy, ADR and Booked Nights of the next month, the next 3 months and the next 6 months to the corresponding month, as well as the past data of quarter-year or semester ago, 1 year ago, 2 years ago and 3 years ago. Furthermore, the data enables you to oppose the rates of past and upcoming changes and predict future trends.
The monthly charts are followed by daily pacing trends for Occupancy, Nights Booked and ADR. These charts help you to visually detect the evolution of future and past demand data for the upcoming 365 days to the data of the same date up to 3 years ago. .png?width=688&height=160&name=pasted%20image%200%20(1).png) Besides the monthly and daily analysis, you can also find the weekly pacing trends. The charts compare the main KPIs on each week of the upcoming year with the Occupancy, Nights Booked and ADR from 1 year, 2 years and even 3 years ago.
Besides the monthly and daily analysis, you can also find the weekly pacing trends. The charts compare the main KPIs on each week of the upcoming year with the Occupancy, Nights Booked and ADR from 1 year, 2 years and even 3 years ago.
.png?width=688&height=196&name=pasted%20image%200%20(2).png)
5.2. Methodology
The methodology behind the Pacing dashboard is similar to the one described in the 'Rates and Demand' data.
To get the data for Occupancy, Nights Books and ADR we monitor the calendars of each property listed in the platform followed by the categorization of the properties. This means that to track the Occupancy levels we would take ratio of Reserved nights and the Total nights (Reserved, Available and Advanced Notice days). For the Nights Booked we would take only the number of Reserved nights. As for the ADR, it shows the average of the price for one night for all available properties in the platform.
Example: Pacing Occupancy for November 22, 2022
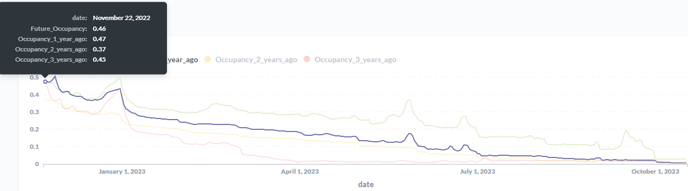
The pacing chart starts from the current date (November 22, 2022, comparing it to the past data November 22, 2021, November 22, 2020, and November 22, 2019) and goes up to 1 year. Since the hosts do not tend to book the vacation rentals many days in advance, when comparing the future data to "1 year ago", "2 years ago" and "3 years ago", we remove the reservations done after that date (in our case starting from November 22nd). This way it shows how occupied the destination is on each day in the upcoming calendar year, with the added benefit of leveraging the occupancy from 1 year ago, 2 years ago and 3 years ago. This way you can compare each interval against themselves and this is also the reason the charts are continuously decreasing.
5.3. Definitions