Measure the economic impact of the alternative accommodation in the destination and monitor, forecast, and benchmark performance, as a basic tool to maximize the recovery post-COVID.
2. Rates & Demand Data
2.1. Charts
2.2. Methodology
2.3. Definitions
2.4. Rates & Demand Data Glossary
2.1. Charts
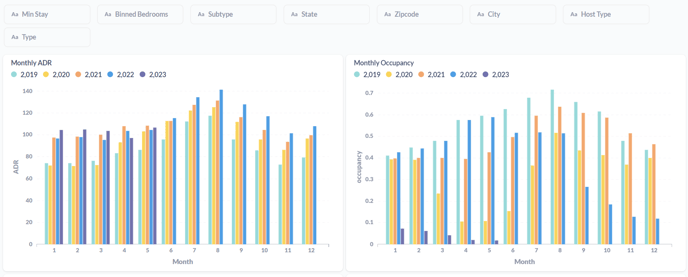
Through the information shown in this section, you can perform an analysis of historical and future occupation, giving you a thorough understanding of past performance and allowing you to forecast upcoming trends.
The rates & demand dashboard is an essential tool to measure the generated economic impact and revenues in the vacation rental segment of your destination. This data shows the average renting price for a month in which all prices included in the analysis are represented in USD. The Monthly occupancy stands for the ratio of occupied listings on a monthly basis. The chart gives an explicit view of vacation rental demand and its evolution since 2019, allowing an analysis of the previous covid period, its impact, and subsequent recovery.
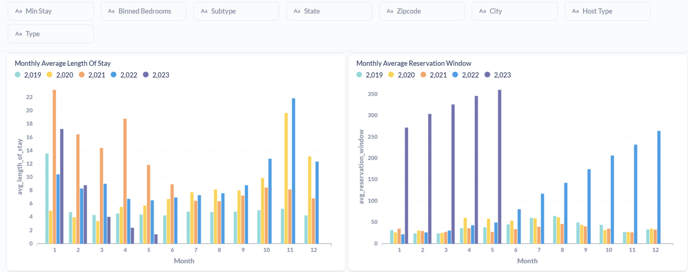
Another useful indicator of vacation rental performance is the Average Length of Stay (LoS) which illustrates on average how long the guests tend to stay in accommodations. The Average Booking Window represents the number of days between when the reservation is done by the guest and the check-in date. It helps to understand the seasonality of the demand for the market by different indicators and set up the needed adjustments.
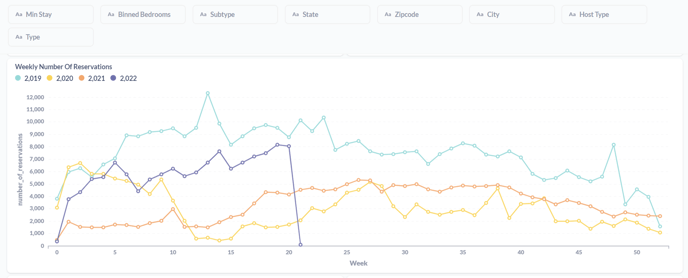
A very practical KPI to visualize the trends of the segment and illustrate the seasonality for the inventory is the number of reservations made by the users; however, note that the cancellations are not represented in this chart.
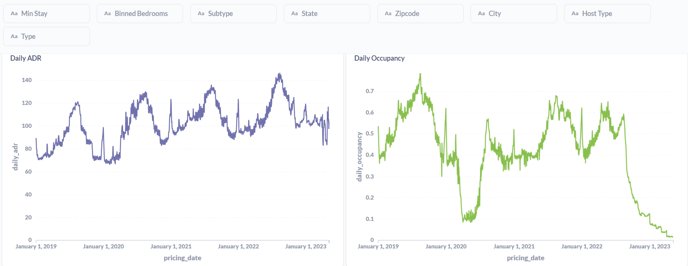
Similarly, we provide detailed pricing data so you can make an analysis of the fluctuation of the daily prices month over month and evaluate its changes by season:
2.2. Methodology
Below, we explain in detail the methodology applied to calculate these indicators.
By looking at the changes we observe in the calendars of each of the properties we can infer the occupancy of the markets. We can categorize the status of the property as the following:
- A: Available Days
- R: Reserved Days
- B: Blocked Days (never been available)
- W: never been available but we don't have enough data to be sure it is blocked (< 200 days)
- N: Advance Notice Days. Is when a
- is not booked but is not either available for booking because the owner asks for a delay before a guest can enter the property (example: delay needed to clean the house or if an owner has a policy of always being present during check-ins but is not available that day, ...).
- L: days we mark as blocked because they are part of reservations with length of stay > 30 days
The occupancy indicates the proportion of occupied accommodations, which is calculated as follows: R/( R + A + N )
2.3. Definitions
- Listing: The number of properties advertised on all platforms: Airbnb, Booking.com, VRBO, and TripAdvisor.
- Monthly ADR: Average Daily Rates, this value represents the base price, excluding cleaning and extra fees.
- Monthly Average Booking Window: The average number of days the property is booked in advance from arrival for the selected period. That means, the period of time between the reservation date and the check-in.
- Monthly Average Length of Stay: The LoS represents the number of nights a guest stays in the property.
- Monthly Occupancy: The percentage of room nights booked in the destination over 30 days based on the total number of active inventory.
- Number of Reservations: Total number of reservations booked by the users in the vacation rental platforms.
- Property: The number of unique properties, i.e. the actual inventory de-duplicated from the different platforms.
2.4. Rates & Demand Data Glossary
Below you will find a table with the rates and demand data glossary in which we include a detailed description of each of the "Export" file columns:
| Field Name | Description |
| Data Address City | City name provided by Google Maps API |
| Data Creation Date | The estimated date when the listing was first listed on the platform. We recommend using a monthly or higher granularity. |
| Occupancy | The percentage of room nights booked in the destination over 30 days based on the total number of active inventory. |
| ADR | Average Daily Rates, this value represents the base price, excluding cleaning and extra fees. |
| Average Lenghth of Stay | The LoS represents the number of nights a guest stays in the property on average |
| Average Booking Window | The average number of days the property is booked in advance from arrival for the selected period. That means the period of time between the reservation date and the check-in. |