Reach out to the correct audience, maximize your marketing efforts and understand the behaviour of the visitors by origin.
3. Visitor Origin
3.2. Methodology
3.3. Definitions
3.4. Visitor Origin Data Glossary
3.1. Visitor Origin Charts
With the following information, it is possible to make an accurate estimate of the origin of travelers staying in alternative accommodations at a destination.
By aggregating the reviews of all the listings in a destination, we can provide data on the following:
- Distribution of domestic and international travelers
- Ranking of the main countries of origin
- Seasonality by country of origin
- The party size
- The preferred type of accommodation
- Review score and satisfaction levels
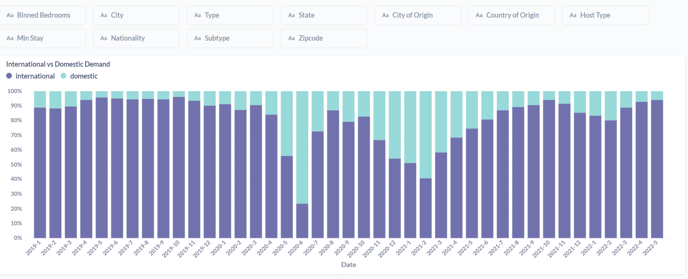
The first chart allows you to compare the International and Domestic Demand for the vacation rentals industry in your selected region. Depending on the nature of the destination, seasonality, and various other factors, the travelers’ demand ratio can vary for certain periods.
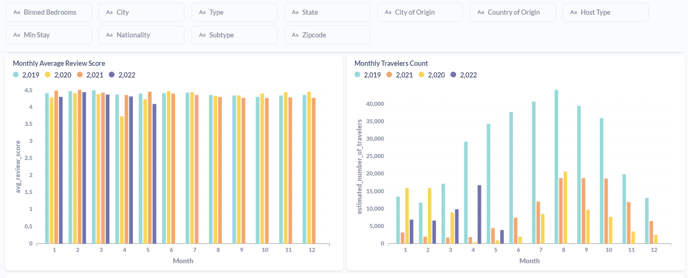
The Monthly Average Review Score displays the average score for accommodations given by the users on the vacation rental platform. In order to make a like-to-like comparison, we have unified the values between the different platforms and the scores range from 0 to 5.
It helps to uncover the satisfaction levels of the travelers and their impact on the perception of the destinations. The monthly traveler count shows the estimated number of travelers to the destination.
As for the following charts, we select the top 10 countries and cities the international travelers originally come from. Through this data, we represent the markets that have the highest demand for short-term vacation rentals in your particular region.
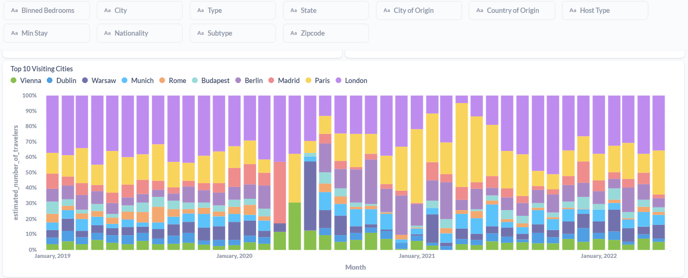
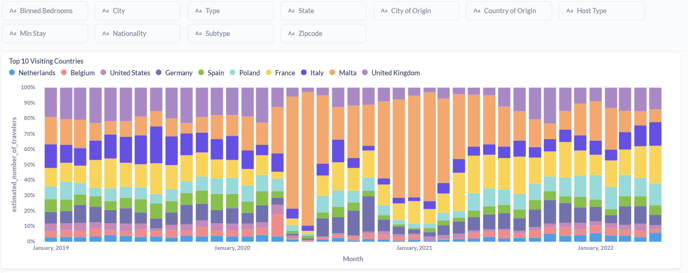
The charts are interactive and you can view the results of a particular city or a country by holding the cursor on the name of that country or the city. In order to generate the raw data, just click on the title of the chart and select the table view option.
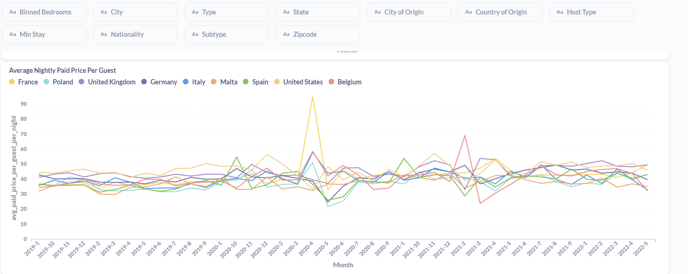
Depending on travelers’ origin the average daily rate can vary from country to country. The following graph shows the average daily prices of the top 10 ranked countries in your region. This data enables you to detect the nationalities that have the greatest expenditure and economic impact on the vacation rental market of your destination.
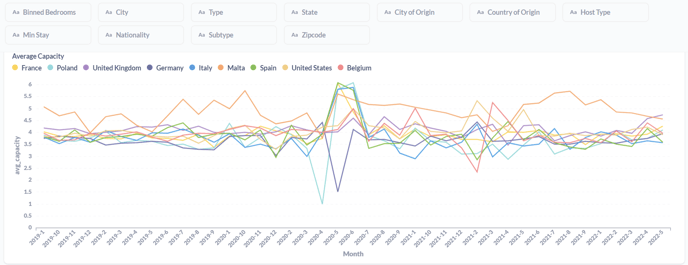
Average Capacity describes how many guests the property hosts on average for the selected top 10 countries with the highest demand. As it describes the average party size of each of the countries of origin, this metric allows you to identify interesting trends on whether they travel in larger groups and therefore prefer to rent larger properties with more capacity, or not, depending on nationality.
For more detailed analysis you can apply filters depending on the number of bedrooms, the cities of your country, types and subtypes of accommodations, travelers’ origin country and city, their nationality, host type, the *minimum stay of the property, and zip code.
With this, it is possible to know how tourists behave over time and thus allows you to focus commercial and marketing efforts on the highest priority segments. Similarly, it is possible to analyze the impact or success of previous campaigns, and how they reflect and impact changes in demand.
3.2. Methodology
Through the public reviews that are posted for each property in a destination, it is possible to identify the user profiles and analyze the country of origin of the guests who have published the reviews.
Here is an example of a property in Madrid published on Airbnb for which there are 18 reviews:

Taking this review as an example, we can see the visitor origin, both the country and the city:
.png?width=688&name=Untitled%20(1).png)
We calculate the number of travelers by multiplying the reviews of the platforms by the guest capacity of the listings where the reviews were left. We also take into account two important variables:
- The percentage of travelers that leave reviews on the platform, represents 2/3 for Airbnb.
- The occupancy rate of the listing. We consider that in general 70% of the property is occupied.
3.3. Definitions
- Average Review Score: The average score published by users to the property in the platform.
- Capacity: Number of people the vacation rental properties can accommodate. This value is calculated by multiplying the number of properties by the advertised capacity.
- Host Type: an indicator of the type of owner. The values can be "SINGLE" in the case of properties managed by a private owner or " MULTI" for those properties managed by owners with at least 2 properties. This indicator shows the degree of professionalization of the market.
- International and Domestic Demand: The demand of international and domestic travelers in the short-term vacation rental market.
- Listing: The number of properties advertised on all platforms: Airbnb, Booking.com, VRBO, and TripAdvisor.
- Minimum Stay: The minimum number of days for the properties available to book by the host. the host can establish a minimum stay for the properties to be booked. Through this filter, you can make an analysis based on this minimum stay established by professional property management companies or single owners. There are several categories which are as followed: 0-3, 4-7, 8-14, 15-30, and 30+ days.
- Monthly Travelers Count: Total estimated number of international and domestic travelers in the market.
- Occupancy Rates: The ratio of rented listings to the total amount of available listings.
- Platform: Platform on which the property is listed.
- Property Subtype: Category of accommodation according to Transparent categorization. Values include APARTMENT, BED_&_BREAKFAST, BOAT, BUNGALOW, CASTLE, CHALET, DORM, GLAMPING, GUEST_HOUSE, HOUSE, OTHER, RV, TOWNHOUSE, VILLA.
- Property Type: The type of property can be: ENTIRE_HOME, PRIVATE_ROOM, SHARED_ROOM, PRIVATE_HOME.
- Top 10 Cities: Top 10 cities that demonstrate the highest demand for the vacation rental market for the region.
- Top 10 Countries: Top 10 countries that demonstrate the highest demand for the vacation rental market for the region.
- Traveler Reviews: The reviews of listings reported by the guests in vacation rental platforms.
- Zip Code: Zip code provided by the API of Google Maps.
3.4. Visitor Origin Data Glossary
Below you will find a table with the visitor origin data glossary in which we include a detailed description of each of the "Export" file columns:
| Field Name | Description |
| Data Addresds City | City name provided by Google Maps API |
| Country of Origin | Country of origin of the user according to the information published on the platform. |
| City of Origin | City of origin of the user according to the information published on the platform. |
| Year | Year in which the user posted the review. |
| Month | Month in which the user posted the review |
| Estimated Number of Travelers | Based on the review count and the capacity of the properties, estimation of the number of travelers visiting the destination for the specified city and date by country/city of origin. |
| Average Raiting | Average score posted by users. |
| Average Capacity | Average capacity of the properties where the review has been posted. |
| Average Advertised Price | Average price of those properties demanded by each nationality. |