Gain an in-depth understanding of vacation rentals, from their location to property type, and more.
- Supply Data
1.1. Supply Map
1.2. Supply Charts
1.3. Further Considerations
1.4. Definitions
1.5. Supply Data Glossary
1. Supply Data
The Supply data demonstrates the ongoing state of the short-term vacation rental market. Since the segment is very fragmented, to attain higher accuracy, Transparent collects data from the top vacation rental platforms (Airbnb, Booking, VRBO, and TripAdvisor).
The inventory we can find in the vacation rental sector is slightly different and more complex compared to traditional accommodation as it is very dynamic, fragmented, and very diverse due to the different types of properties we can find.
Through supply data we can perform a detailed and granular analysis to solve these 3 difficulties:
- Evolution: first of all, we can perform a historical analysis of this inventory and evaluate how it changes over time and in reaction to specific events.
- Fragmentation: we will have full visibility of the actual number of properties at each destination as we previously performed a deduplication exercise in which we identified those properties listed on multiple platforms.
- Diversity: we find all the information regarding the type and subtype of properties so it is possible to perform a granular analysis of the different types and subtypes of inventory offered at the destination.
Do you want to know more about some particularities of short-term rental? Check out this article in our blog where we debunk some of the most common misconceptions: 6 common misconceptions about vacation rentals – in data
1.1. Supply Map
The supply map view allows you to visualise the short-term rental market of your particular location. You can access it by the link on the top of the supply page:
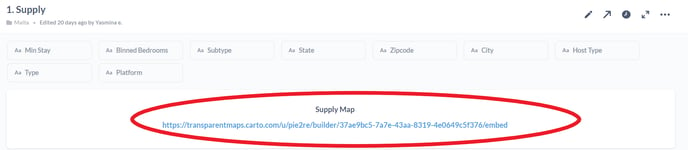
The map is interactive and you are able to zoom in and move around the map, while statistics and KPIs on the right-hand of the page update dynamically.
You can apply a variety of filters that will help you find the answer to your particular query and analyse the total supply of properties, with each dot on the map representing a unique and active property.
You can layer the properties by clicking on the category you are interested in, or color code the filters to visualize the distribution of different categories to analyze the market supply by property count, total capacity, the regions of your country, average review score, review count, property type, host type and the number of bedrooms.
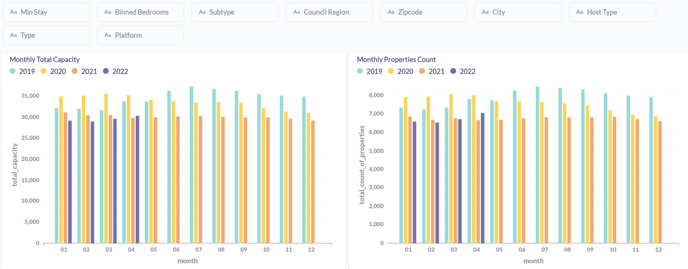
1.2. Supply Charts
With this view, you’ll find a number of features to analyze the available vacation rental inventory of your destination. This will allow you to get a complete overview of the current situation as well as compare and evaluate the historical data.
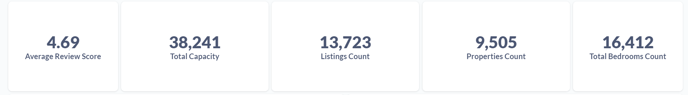
Firstly, there are the general KPIs of the short-term vacation segment: the Average Review Scores of the properties ranked by the users in vacation rental platforms, the Total Capacity of all properties included in your dataset, the number of Total Listings, The Count of unique Properties and the Count of their total Bedrooms.
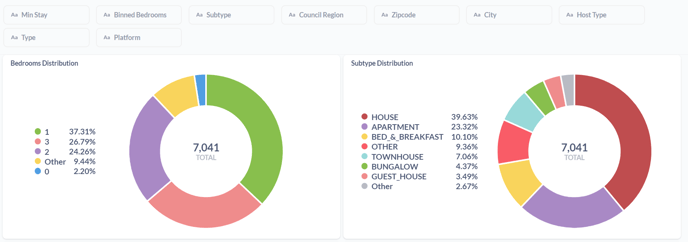
This data is followed by additional charts that provide a more detailed view; for instance, the Bedroom Distribution chart will give you a general overview of the number of bedrooms the accommodations offer, while the Subtype Distribution chart illustrates which type of properties cover most of the short-term vacation rental segment.
In addition, the illustrations of the evolution of the market give you a more thorough review of the vacation rental industry. The Monthly Total Capacity shows the total number of guests the properties can accommodate, and the Monthly Property Count is the sum of all properties in your specified region.
The inventory is calculated in terms of the total number of de-duplicated properties as well as the capacity indicated in the listings.
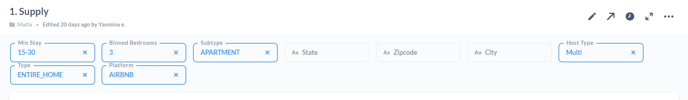
There are a number of filters to adjust the charts and review the data for different cities or states, property types and subtypes, minimum stay of the guests, the number of bedrooms in the property, the type of the host, and even choose the vacation rental platform you are interested in. You are able to select several filters at the same time.
1.3. Further Considerations
Our system has a recall rate (we do not find 100% of the listings). We consider that an acceptable recall rate is 95% of the global listing count on a monthly basis. Sometimes platforms change their websites and we need to adapt our systems to be able to maintain a high recall rate. This may temporarily affect the data. You will be notified when these changes occur.
1.4. Definitions
- Active Listing: A listing is considered active if it is searchable and can be found on one of the platforms (Airbnb, Booking.com, Vrbo, and TripAdvisor) without date filters.
- Active Property: If the property is searchable by a traveler, we consider it active.
- Average Review Score: The average score provided by users to the property in the platform.
- Bedroom Distribution: The ratio of listings with various room numbers within the selected area. The number of rooms in properties can vary from 0 (studios) to more than 6.
- Binned Bedrooms: A filter you can apply to select the number of rooms of the properties in the market (varies from 0 to 6+).
- Capacity: Number of people the vacation rental properties can accommodate. This value is calculated by multiplying the number of properties by the average advertised capacity.
- Deduplication: by a deduplication process, we are able to get the number of properties instead of the number of listings. This system is trained to identify if a property is listed on different platforms and then we combine the "cross-listed" properties.
- Host Type: an indicator of the type of owner. The values can be "SINGLE" in the case of properties managed by a private owner or " MULTI" for those properties managed by owners with at least 2 properties. This indicator shows the degree of professionalisation of the market.
- Listing Count: The number of properties that can be advertised over all platforms: Airbnb, Booking.com, VRBO, and TripAdvisor.
- Property Count: Total number of unique and deduplicated properties i.e, even if the property has been listed in several platforms, it will count as 1.
- Platform: A vacation rental platform on which the property is listed.
- Minimum Stay: The minimum number of days for the properties available to book by the host. The host can establish a minimum stay for the properties to be booked. Through this filter, you can make an analysis based on this minimum stay established by professional property management companies or single owners. There are several categories which are as followed: 0-3, 4-7, 8-14, 15-30, and 30+ days.
- Property Subtype: Category of accommodation according to Transparent categorization. Values include up to 14 subcategories: APARTMENT, BED_&_BREAKFAST, BOAT, BUNGALOW, CASTLE, CHALET, DORM, GLAMPING, GUEST_HOUSE, HOUSE, OTHER, RV, TOWNHOUSE, VILLA.
- Property Type: The type of property can be: ENTIRE_HOME, PRIVATE_ROOM, SHARED_ROOM.
- Review Count: Total number of reviews of the listings.
- Subtype Distribution: The ratio of listings subtypes within the selected area.
- Total Bedroom Count: Total number of listing rooms within the selected area.
- Total Capacity: The sum of capacities of all the properties within a particular region.
- Total Listings: The sum of all listings in the selected area.
- Unique Property: A property de-duplicated from different platforms.
1.5. Supply Data Glossary
Below you will find a table with the supply data glossary in which we include a detailed description of each of the "Export" file columns:
| Field Name | Description |
| Year | Year of the supply. Supply file will contain all listings that have been active at some point during this year |
| Month | Month of the supply. Supply file will contain all listings that have been active at some point during this month |
| Data Address City | City name provided by Google Maps API |
| Data Address State | State name provided by Google Maps API |
| Data Address County | County name provided by Google Maps API |
| Data Address Zip Code | Zip code provided by google maps API |
| Data Type | The type of property can be: ENTIRE_HOME, PRIVATE_ROOM, SHARED_ROOM, PRIVATE_HOME |
| Data Subtype | The category of accommodation according to Transparent's categorization. Value can be as follow: APARTMENT, BED_&_BREAKFAST, BOAT, BUNGALOW, CASTLE, CHALET, DORM, GLAMPING, GUEST_HOUSE, HOSTEL, HOTEL, HOUSE, OTHER, RV, TOWNHOUSE, VILLA |
| Host Type | An indicator of the type of owner. The values can be "SINGLE" in the case of properties managed by a private owner or " MULTI" for those properties managed by owners with at least 2 properties. This indicator shows the degree of professionalisation of the market. |
| Total Count of Properties | Total number of unique and deduplicated properties i.e, even if the property has been listed in several platforms, it will count as 1. |
| Total Bedrooms | Total number of bedrooms. |
| Total Capacity | The total sum of the number of people that the listings can host. |
| Average Review Score | Review score as declared on the platform. Note: this field is unified so it can be compared across platform without any treatment. |
| Review Count | Number of reviews of the listing. |
| Data Meta Platform | Platform the listing is taken from: AIRBNB, BOOKING.COM, HOMEAWAY, TRIPADVISOR. |
| Property ID | Unique ID for each property to be used to deduplicate the inventory and understand which listings are available on multiple platforms. |
| Unified ID | Unique ID generated by Transparent for each listing. |
| Data Address Country Code | Country code provided by Google Maps API. |
| Data Location Coordinates Latitude | Latitude of property as displayed on the platform. For Airbnb the coordinates are randomized within 500 meters. |
| Data Location Coordinates Longitude | Longitude of property as displayed on the platform. For Airbnb the coordinates are randomized within 500 meters. |
| Data Address Street Name | Street name provided by Google Maps API. |
| Data Bathrooms | The number of bathrooms. |
| Data Bedrooms | The number of bedrooms. |
| Data Beds | The number of beds. |
| Data Capacity | The number of person that the listing can host. |
| Data Title | The title of the listing. |
| Data URL | The url of the listing. |
| Is Primary Property ID | True / false indicator if this is the main ID for this property. Filtering on only True values will give you the deduplicated number of properties available. |