Supply recreating the tab of Smart Rental Pro, giving you an overview of properties of your market, the trends in short-term rental, but also to provide analysis of your reviews and general metrics of the market
Numbers below are provided for an example market:
Supply Map View 🔎
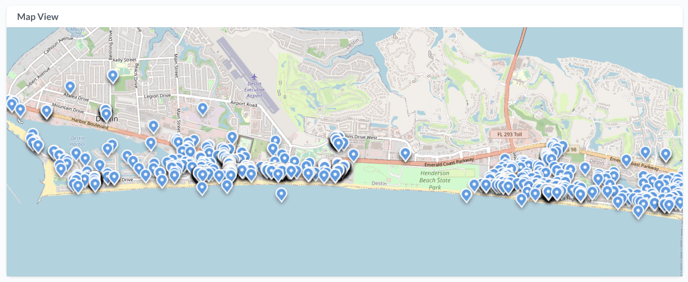
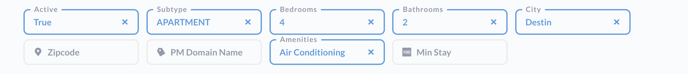
Supply begins with a map overview of your market and default filters on top, gives you a bird-eye view of the area of your operation, density of the market supply and hot zones. Using filters on top of the dashboard, you can create any specific comp-set to see on the map, for example:
Active apartments of 4 bedrooms and 2 bathrooms in the Destin city with Air Conditioning:
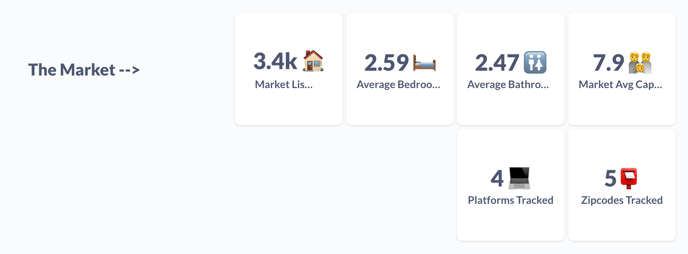
The next thing you'll see is the distribution of your chosen market and filters by number of listings, average of bedrooms, bathrooms, capacity, platforms and Zipcodes tracked:
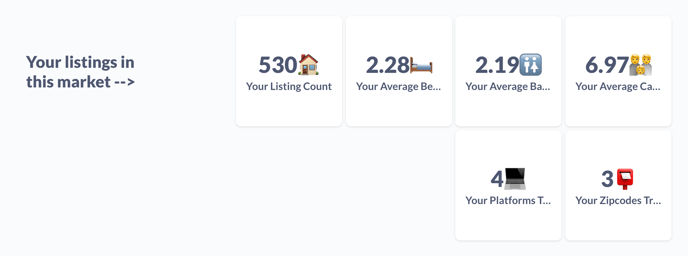
Same for your listings in the market:
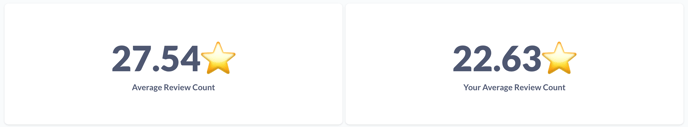
The next one would be the stats of the of yours and market reviews performance with the count of the reviews first:
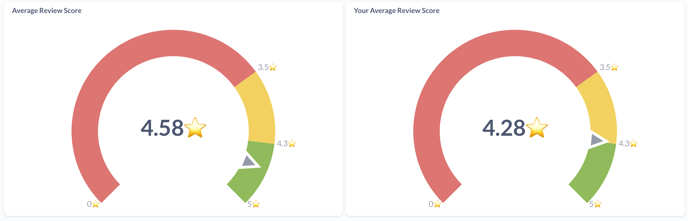
And the average reviews score below it:
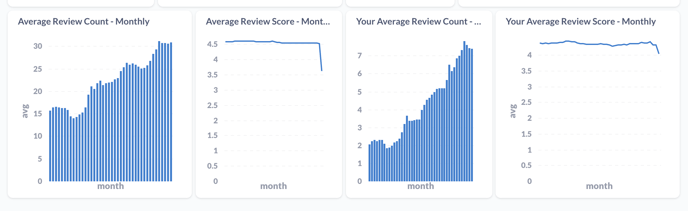
As well as it's evolution through the time:
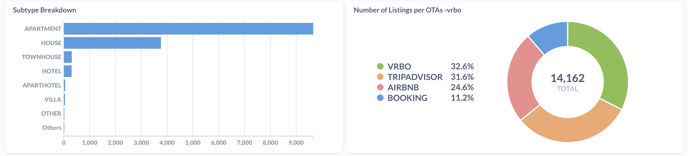
Market Breakdowns 🧩
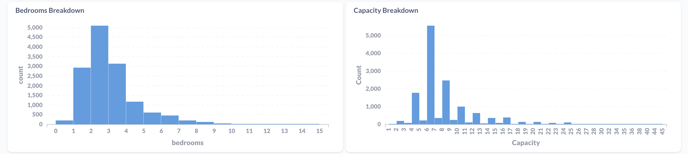
This is the part of the dashboard where you can see the market distribution of property accommodation properties broken down by the graphs. Please keep in mind that your properties are included in the metrics below.
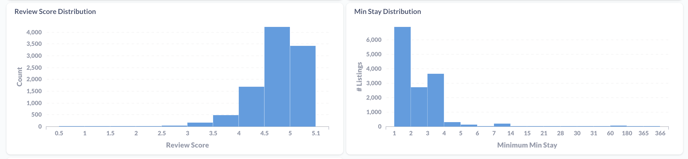
Bedrooms and Capacity breakdown:
Review Score and Minimum Night stay distribution, as well if it's Instant-bookable or not:
In case you need any help — contact our support team:
📧 Email: shorttermrental.support@mylighthouse.com
Our dedicated support team is here to assist you. Whether you have questions, encounter issues, or need guidance, we're just an email away.