The Rate & Demand dashboard is replicating the functional of the equal tab in the Smart Rental Pro, allowing you to benchmark key metrics against your rental market
Numbers below are provided for an example market.
Our benchmark estimate analysis is used to compare your performance against the market, displaying short-term rental metrics of occupancy, ADR, reservation window, and length of stay. This essentially compares your properties against the market through averages in the aforementioned vacation rental measurements. By ‘plugging in’ your identified competitive sets, you can make comparisons and adjustments in a more refined way.
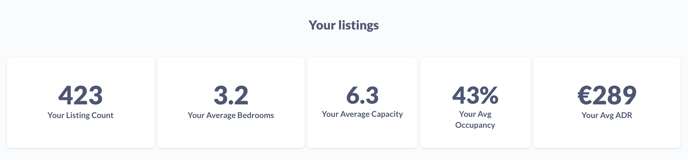
Beginning with a simple overview of yours and market's listings' quantity and stats, under the filters you've chosen:

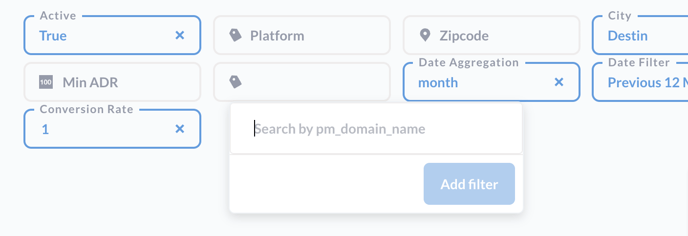
The strength of this dashboard is in a very powerful PM Domain filter — where "PM Domain" stands for the www.example.com URL of your competitor, to rephrase, if you know your competitor name, big chances are our mapping team has already sorted them in your market, and you can put yourself in a direct comparison with them just by inputting their name here:
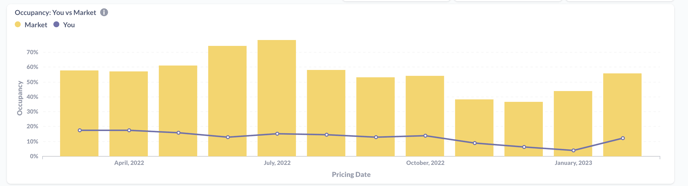
Visualising the Occupancy chart of yours and your competitor, or market, where you are a blue line vs competitors' (markets') yellow bars:
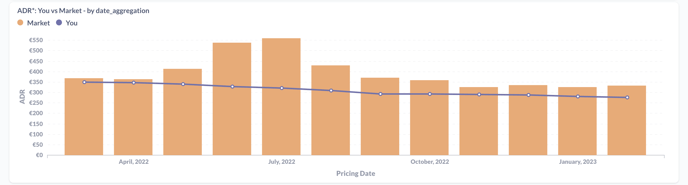
ADR:
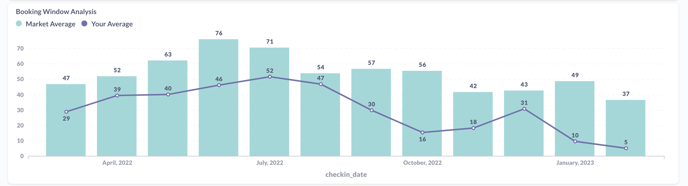
Booking window (lead time, the time of how many days in advance people are booking the properties):
Length of stay: 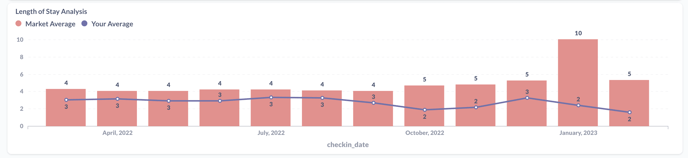
In case you need any help — contact our support team:
📧 Email: shorttermrental.support@mylighthouse.com
Our dedicated support team is here to assist you. Whether you have questions, encounter issues, or need guidance, we're just an email away.