Measure the rate at which bookings are filling as the check-in date approaches with the Smart Rental Pro Plus
The dashboard integrates Occupancy and Average Daily Rate (ADR) charts, providing insights into the daily, weekly, and monthly evolution over a two-year period. Pacing trends show market occupancy levels and average ADR (in USD) for the upcoming year, allowing comparisons with past and future data for more detailed analysis on a monthly, weekly, and daily basis.
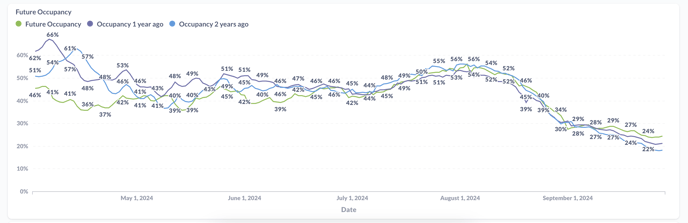
The Future Occupancy chart provides a comparative analysis with historical data and extending up to one year into the future. This eases the measurement of the booking trends of their competitive set over the previous year leading up to the present date and to contrast it with the future occupancy data from two years prior.
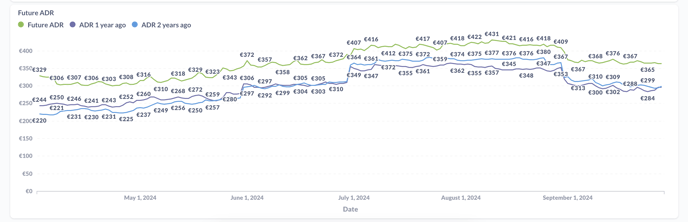
The Future ADR feature displays the average daily rates for bookings of the market over the next 365 days, assisting in the identification of target dates within each season. Unlike the ADR graph in Rate and Demand, this graph offers a view on the previous dates compared to current, providing valuable insights into market dynamics and pricing strategies.
In case you need any help — contact our support team:
📧 Email: shorttermrental.support@mylighthouse.com
Our dedicated support team is here to assist you. Whether you have questions, encounter issues, or need guidance, we're just an email away.