Take a look at your main competitors, gain perspective about your market performance, identify the areas of improvement.
4. Benchmarking
The benchmarking analysis allows you to review and compare your market performance level against other short-term vacation rental markets. In your dashboard you will find up to 5 competitor markets which are not restricted to any geographical area (countries, cities, regions and other geographical areas).
The benchkmarking includes the evaluation by main descriptive KPIs in every STR market. The supply data similar to the supply dashboard is updated on a monthly basis, and the demand data is updated weekly accordingly.
4.1. Benchmarking Charts
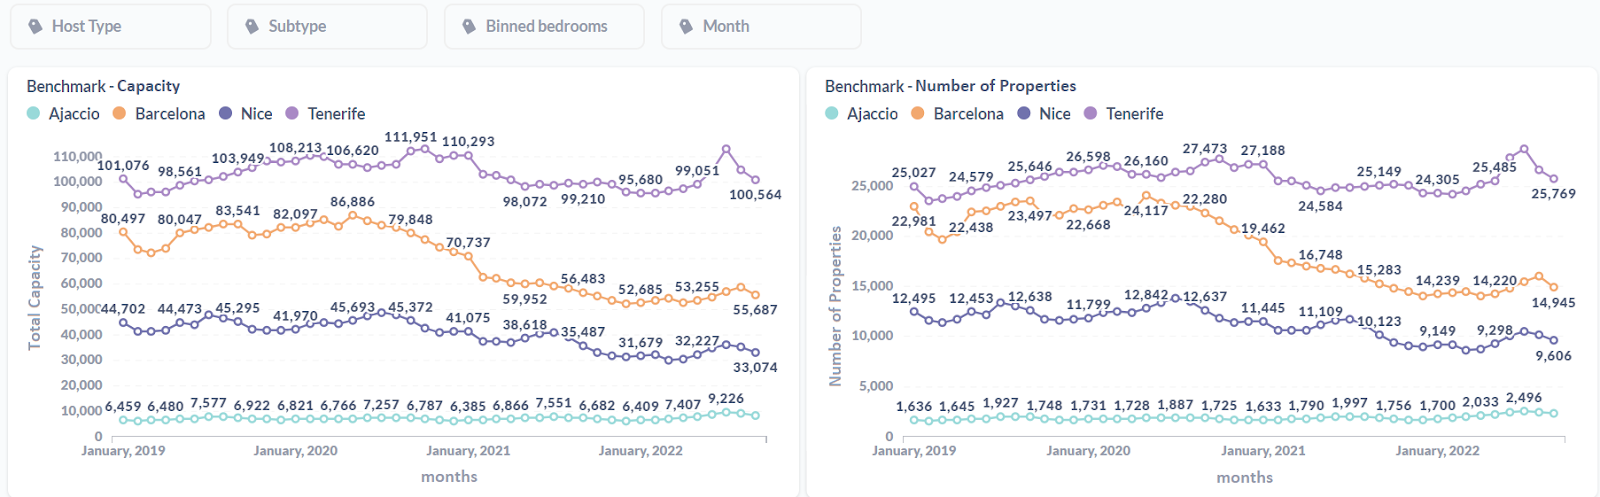
To evaluate the current state of STR market supply the main characteristics are Number of Properties and the Capacity. These charts are quite useful when contrasting the total number of listings next to the maximum number of guests that the vacation rentals can host.
The next charts display the Average Length of Stay of the visitors in comparison to other markets and monthly Average Booking Window of the properties. The ALoS data is highly dependent on the seasonality factor and helps you to get a better view for the analysis of VR markets' demand closer to the peak of the season. Based on this factor visitors tend to book the rentals earlier hereby indicating the increase for the market demand.

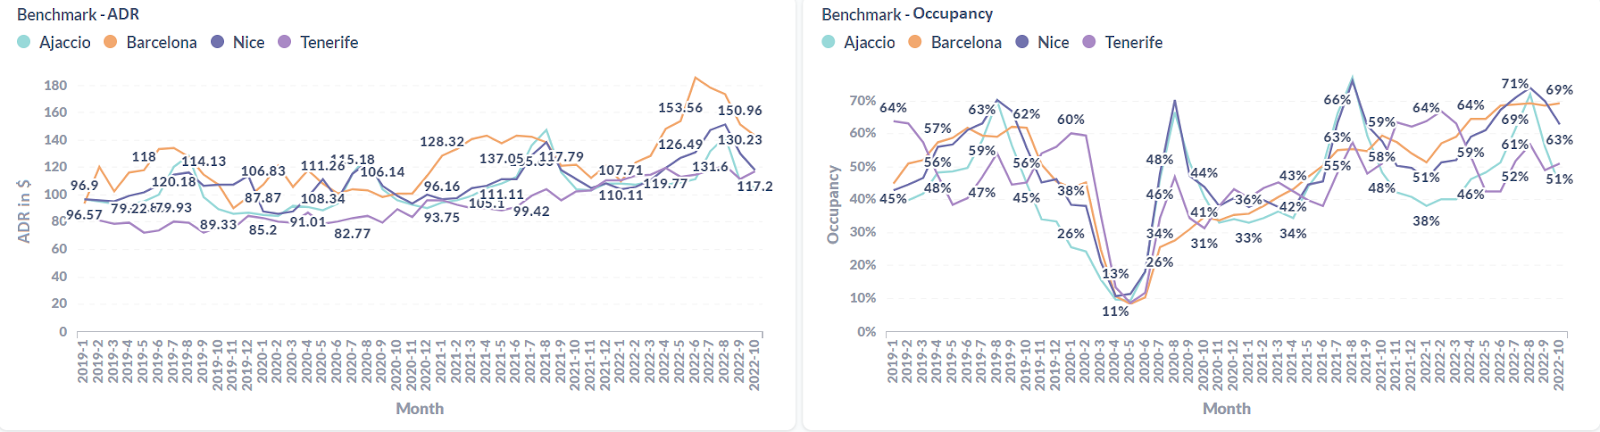
Finally, the benchmarking dashboard includes the data analysis based on the ADR and Occupancy. Through these charts you can evaluate you monthly occupation rates in comparison to other markets. The ADR data will bring some insights on how the prices vary in different regions and if they affect the occupancy levels of the STR industry.
Similarly like the previous dashboards there are several filters that will help you to get more detailed overview regarding the professionalization levels of the market, the subtypes of properties, number of bedrooms and obtaining the data for the pervious months up to January 2019.
4.2. Definitions
- Capacity: Number of people the vacation rental properties can accommodate. This value is calculated by multiplying the number of properties by the average advertised capacity.
- Number of Properties: The total number of properties listed in vacation rental platforms within the selected area.
- Monthly Average Booking Window: The average number of days the property is booked in advance from arrival for the selected period. That means, the period of time between the reservation date and the check-in.
- Monthly Average Length of Stay: The LoS represents the number of nights a guest stays in the property.
- Monthly Occupancy: The percentage of room nights booked in the destination over 30 days based on the total number of active inventory.
- Monthly ADR: Average Daily Rates, this value represents the base price, excluding cleaning and extra fees.