This dashboard will help you to understand how did the market grew in terms of the supply on each platform and it's subtypes
Numbers below are provided for an example market.
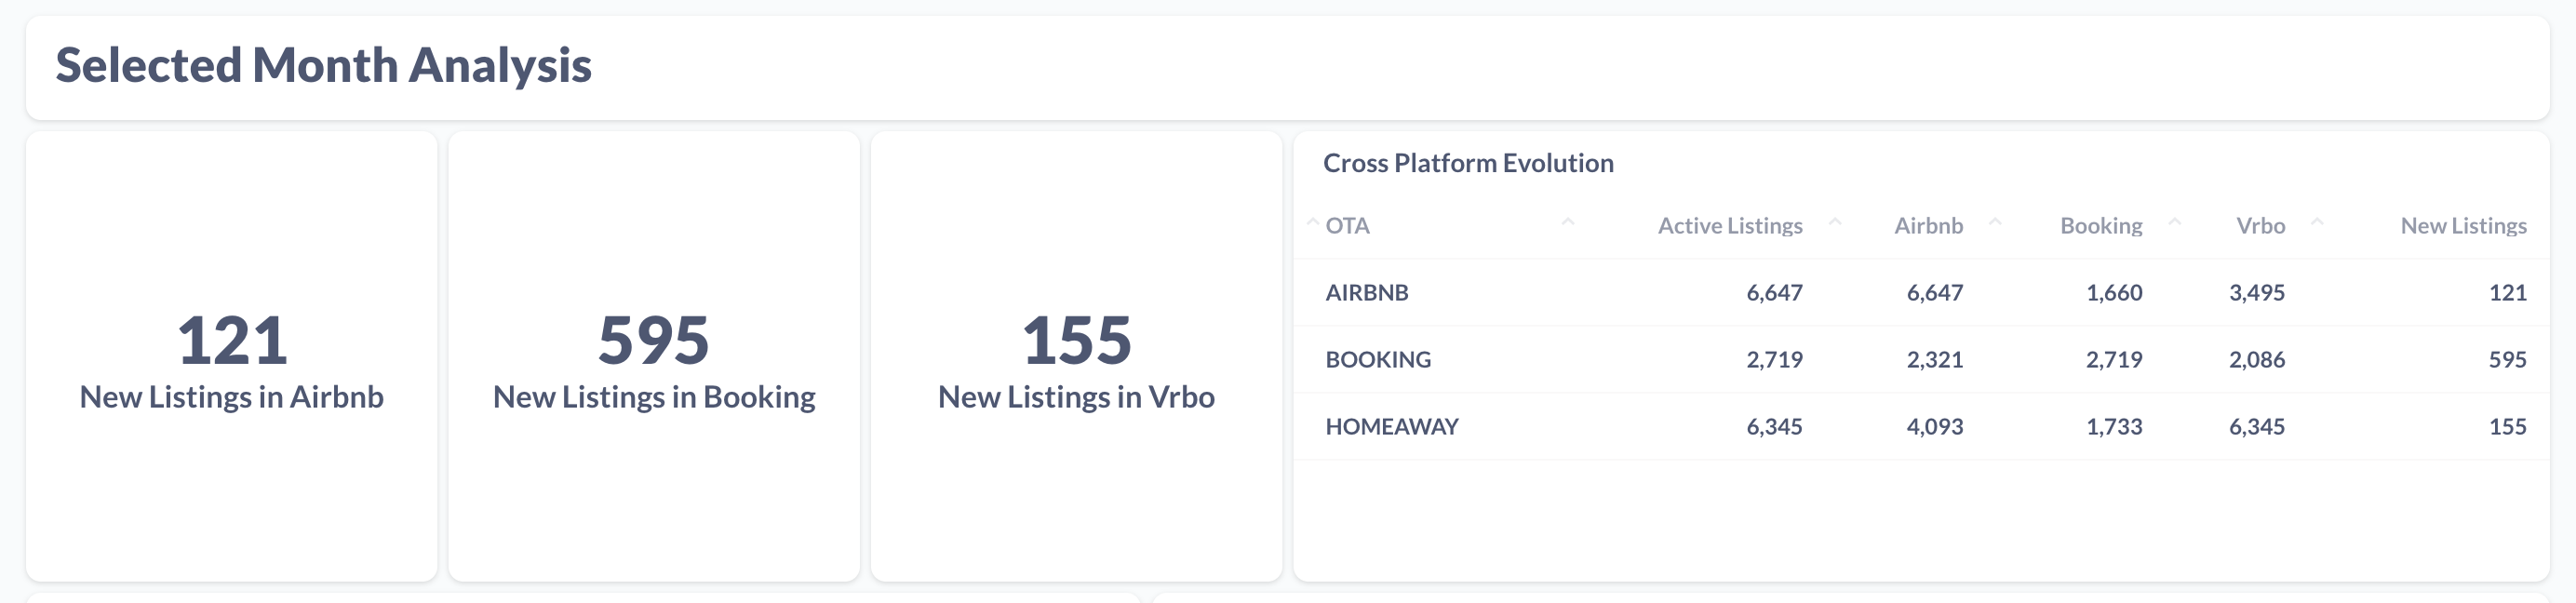
Inventory Growth dashboard is a very powerful tool for analysing your supply growth in the area add-on performance using simple filters very easy, all you need to do is to choose your selected month of analysis:

Also, there you can choose the competitor to see (PM Domain Name), Platform (OTA), City, Zipcode, Subtype and number of Bedrooms.
Right after you see how many listings have appeared on each platform of your chosen month:
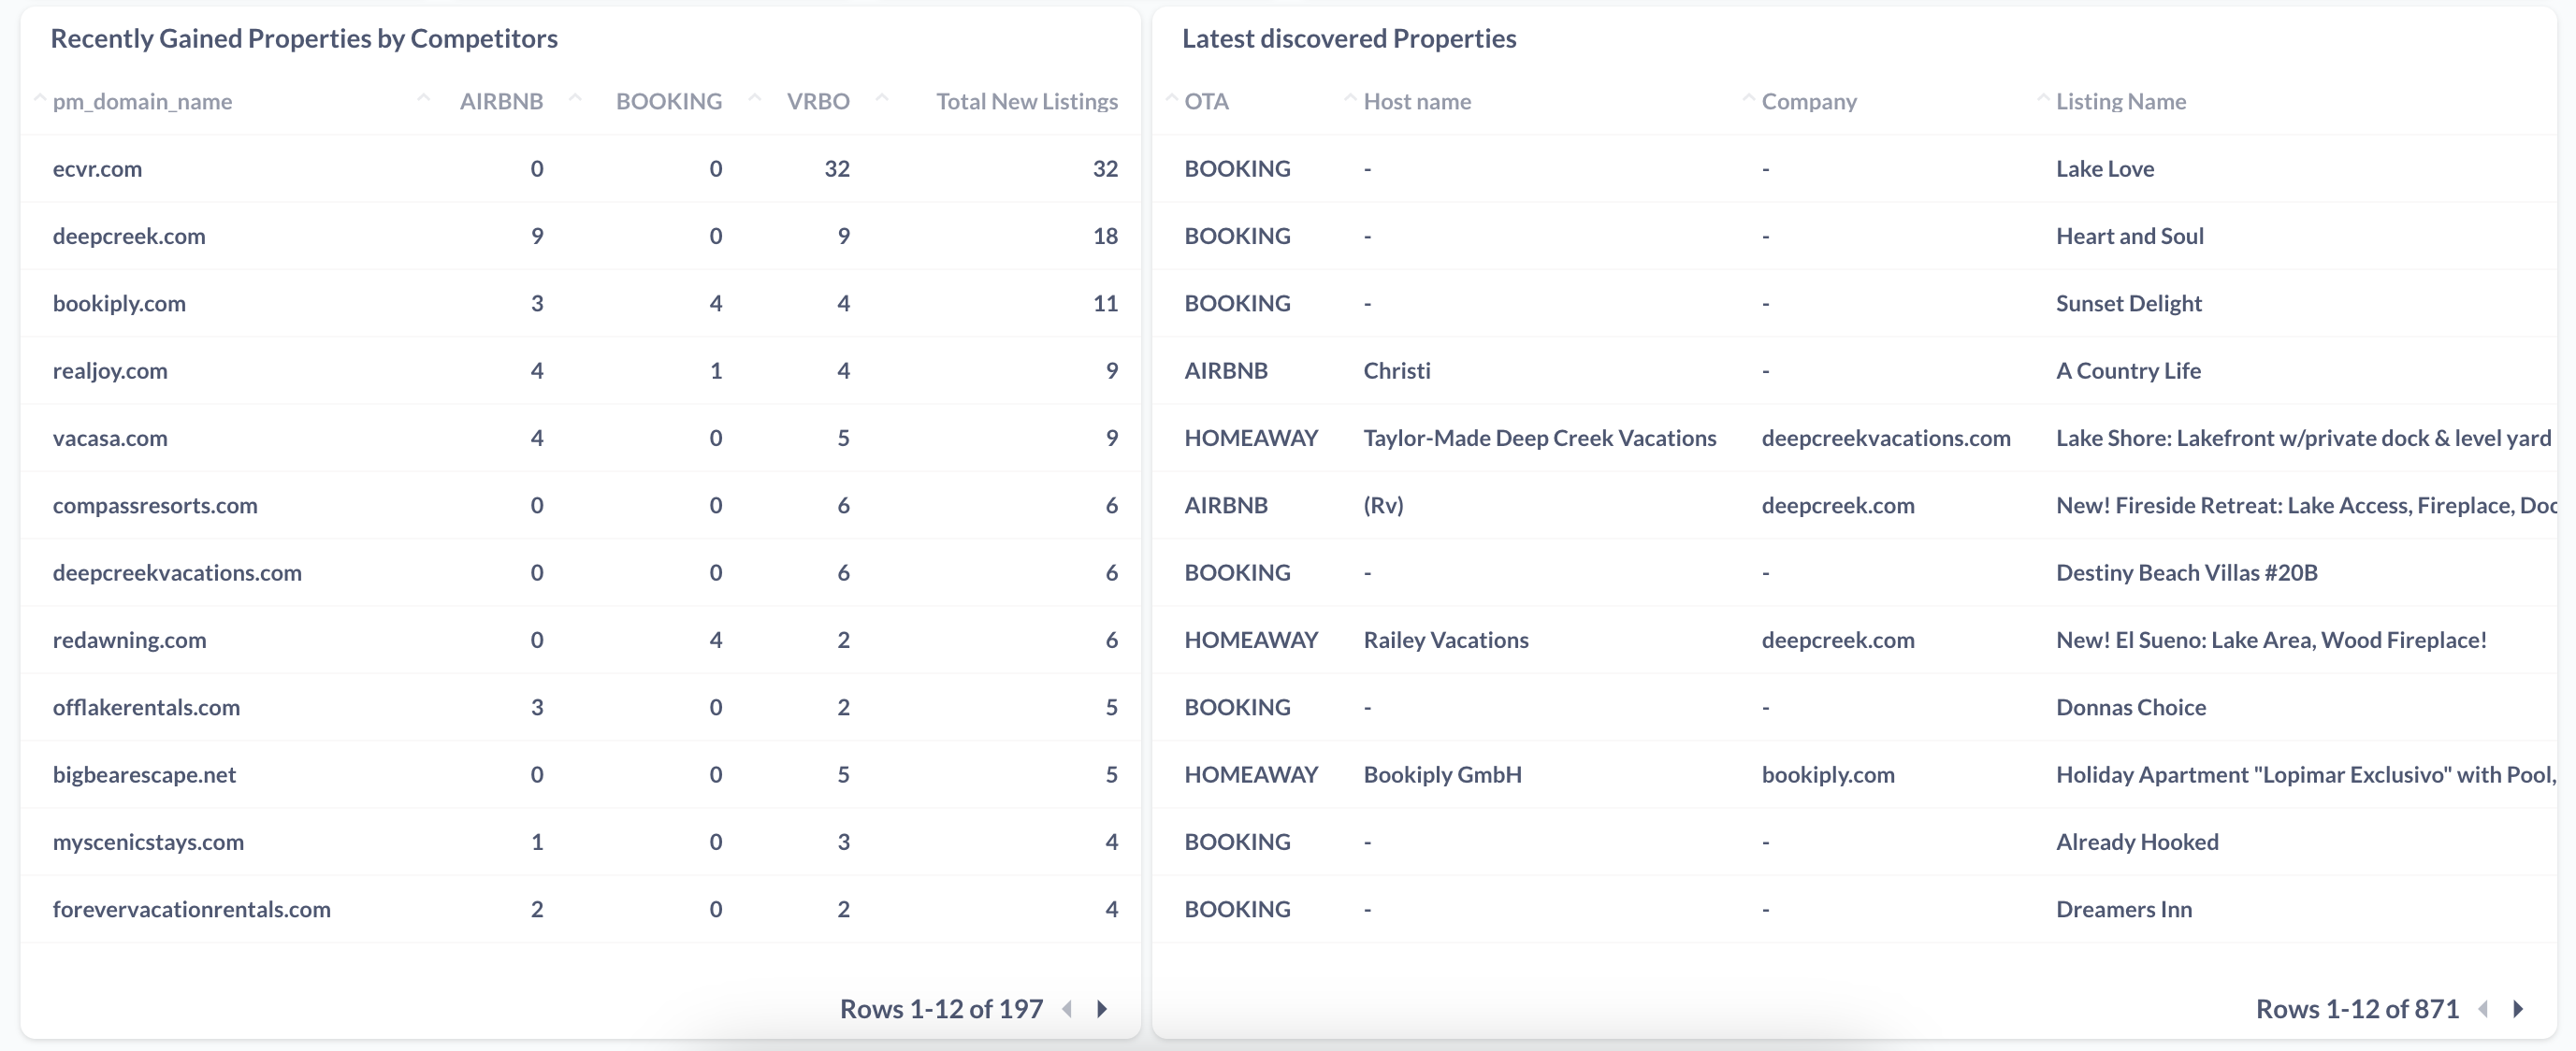
A bit below you can see the properties count which has your competitors obtained, as well as the latest added properties with it's platform, name, if possible — management owner and link.
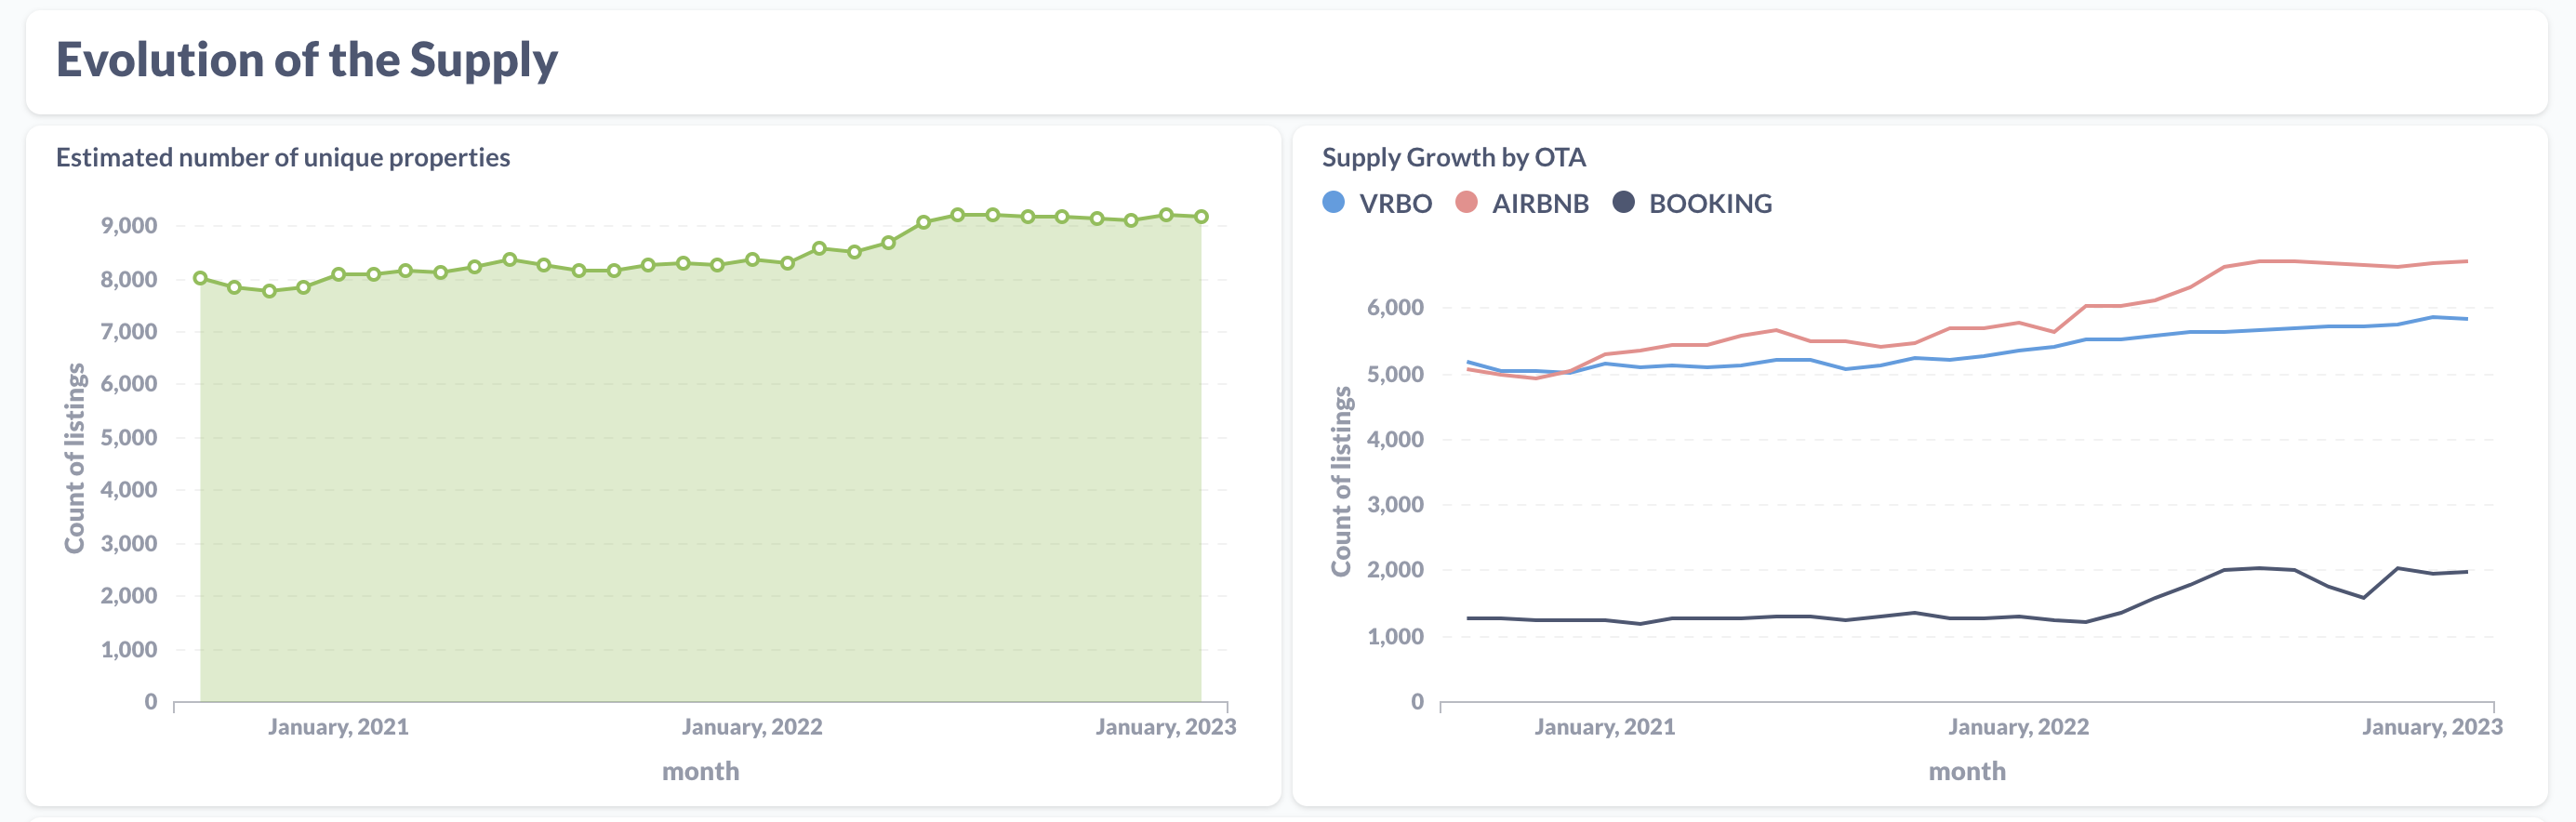
Evolution of the Supply will show you the estimated number of new properties evolved in the whole market, when the Supply Growth by OTA will show you which platforms are predominant in the area and how did they behave in the latest time:
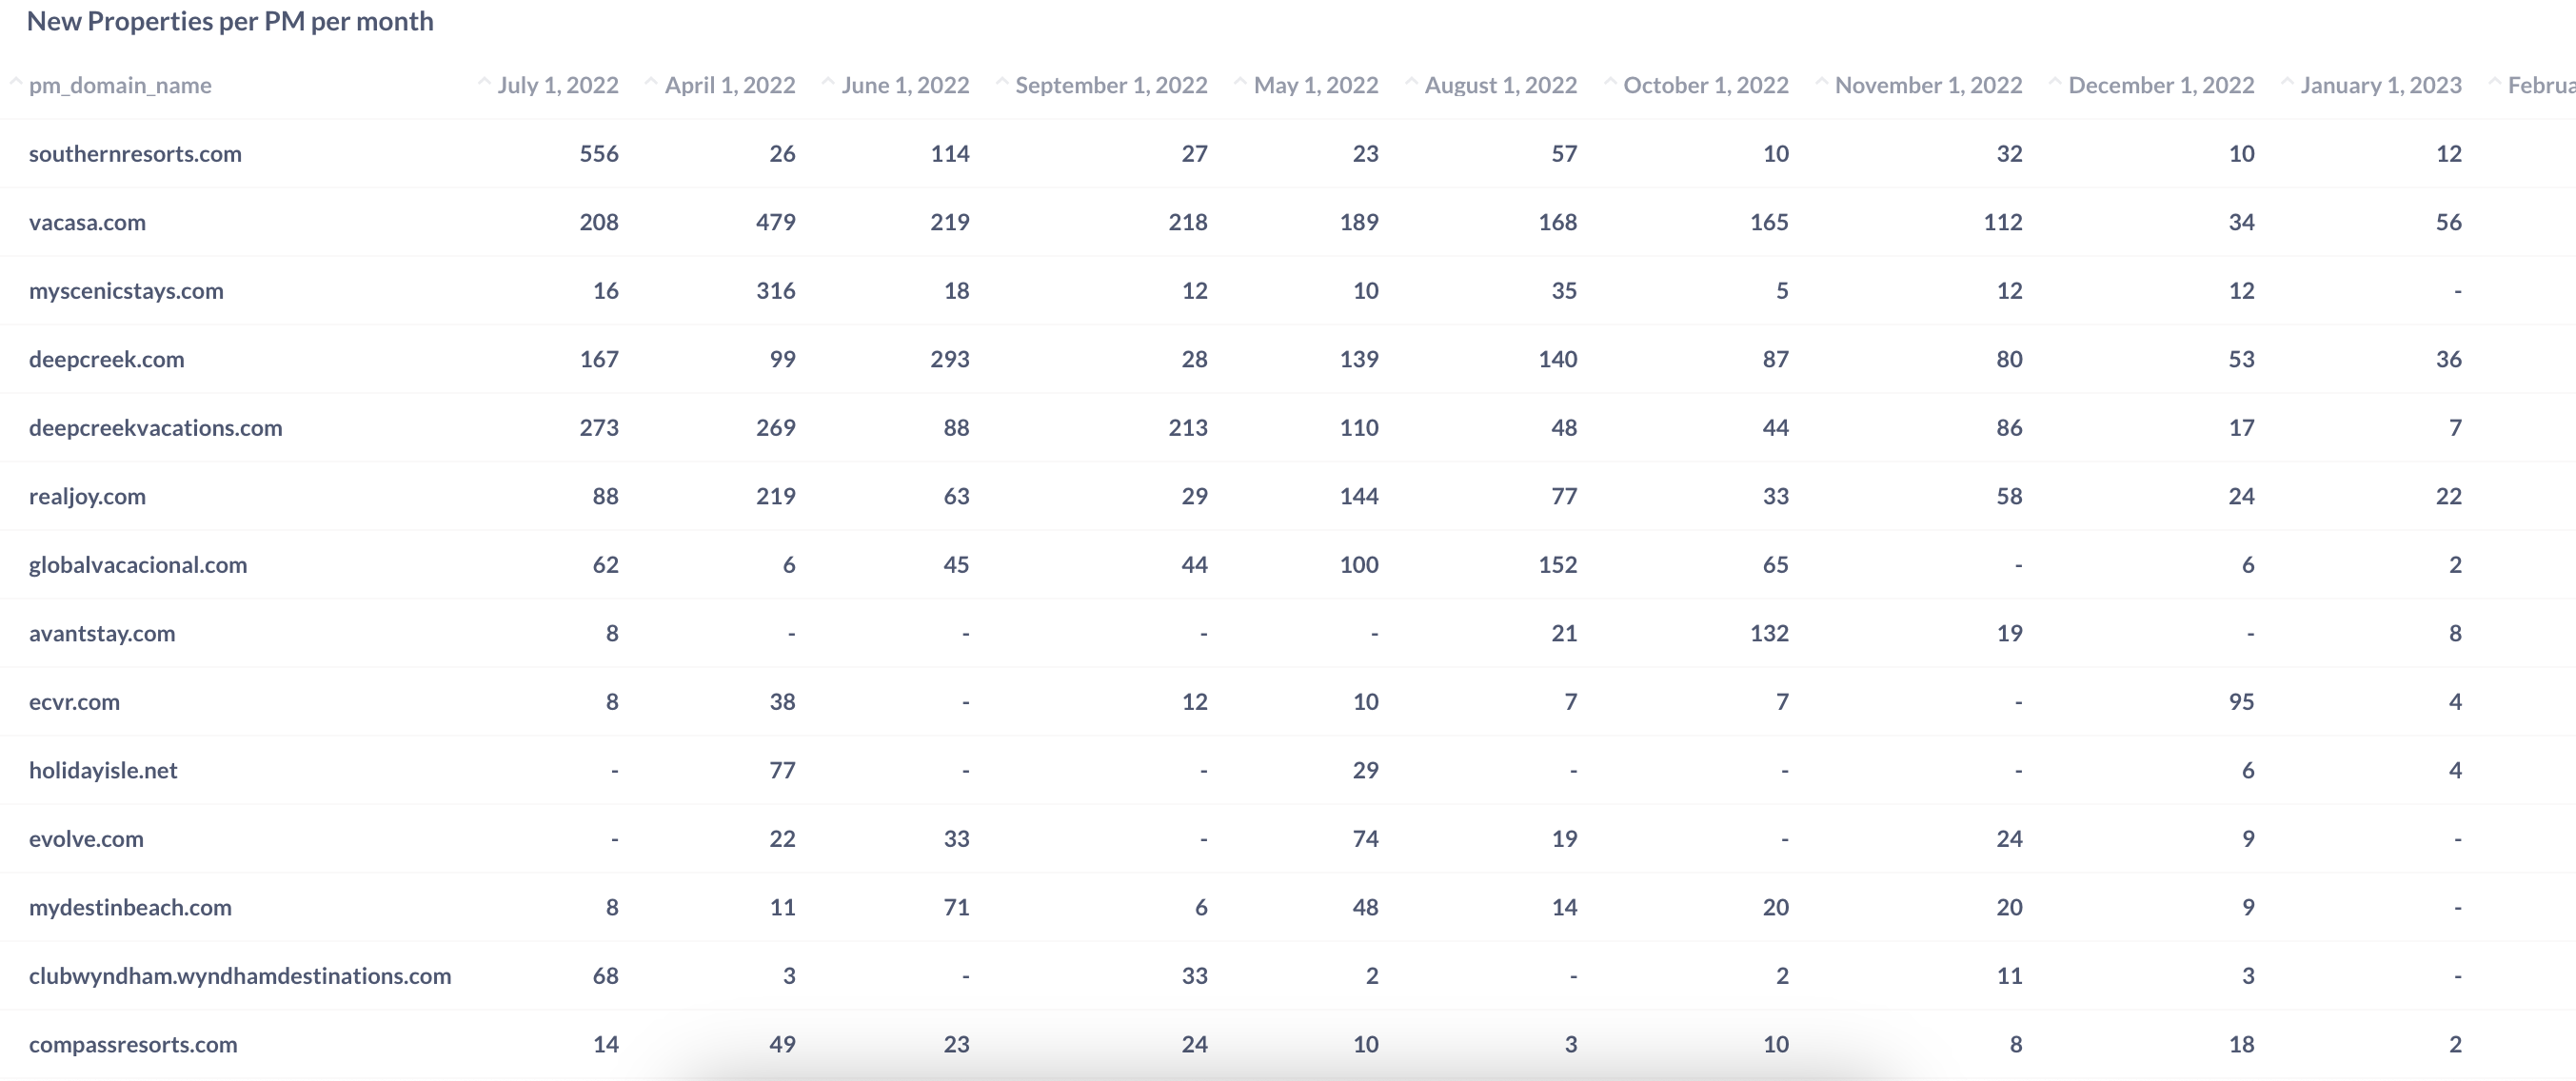
The last question would be the "New properties per PM per (chosen) month", which will show you how many new properties has each PM of your market obtained in the last 30 days: