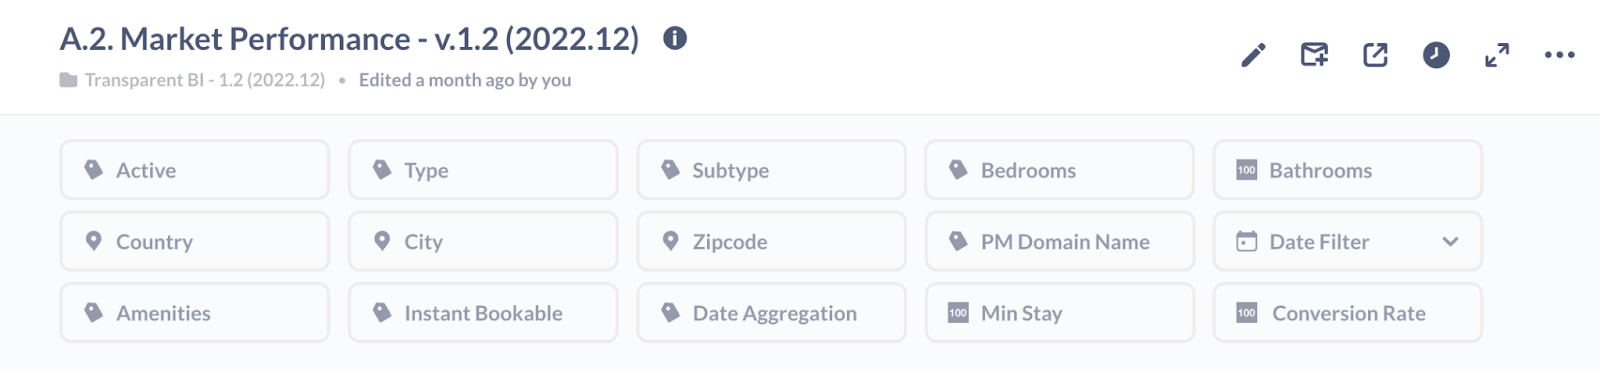
The Market Performance dashboard is a one-stop-shop for the most important market metrics; a must-have, which brings a comprehensive yet easy to understand overview of your location
.png?width=688&height=387&name=A.2._Market_Performance%20(1).png)
Numbers below are provided for an example market.
Let’s take a quick overview of the dashboard’s main facilities:
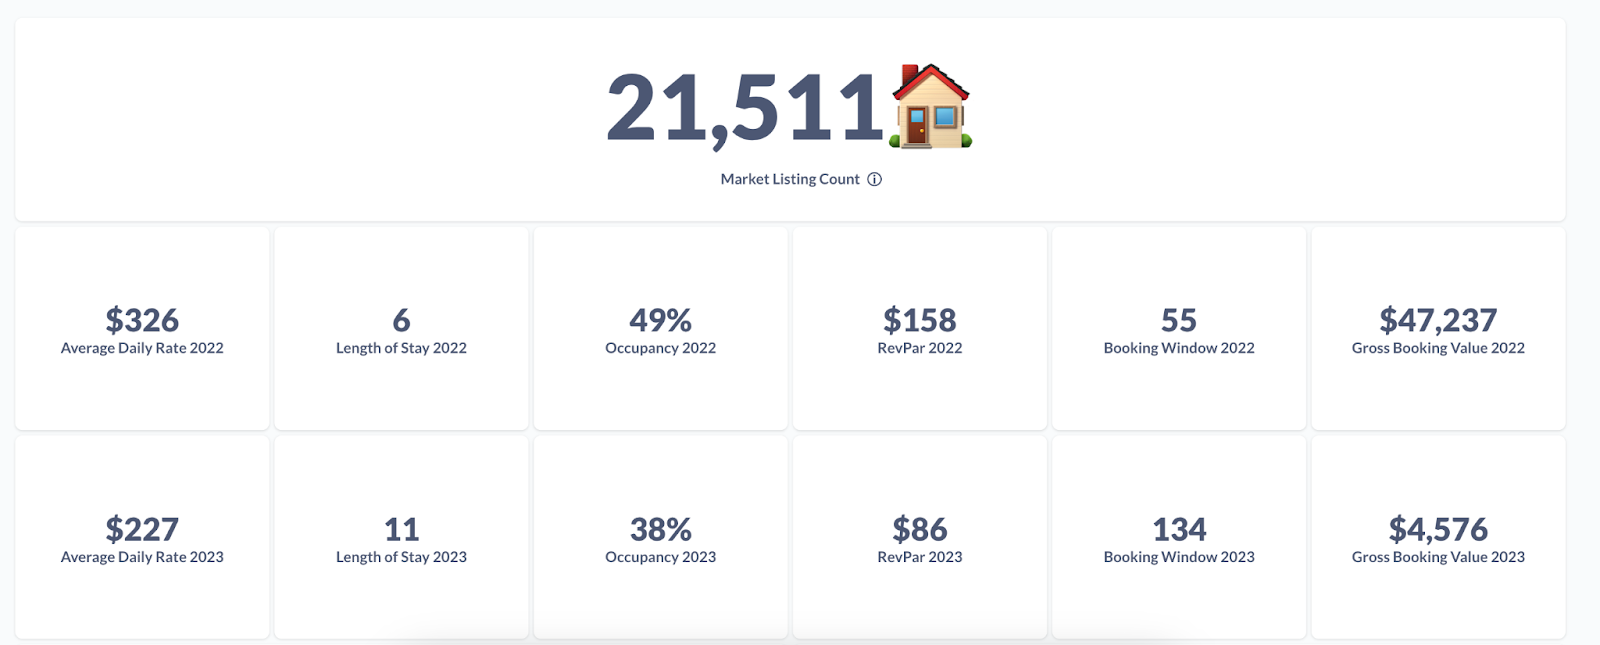
- Market listing count — active number of listings in your area depending on your filters.
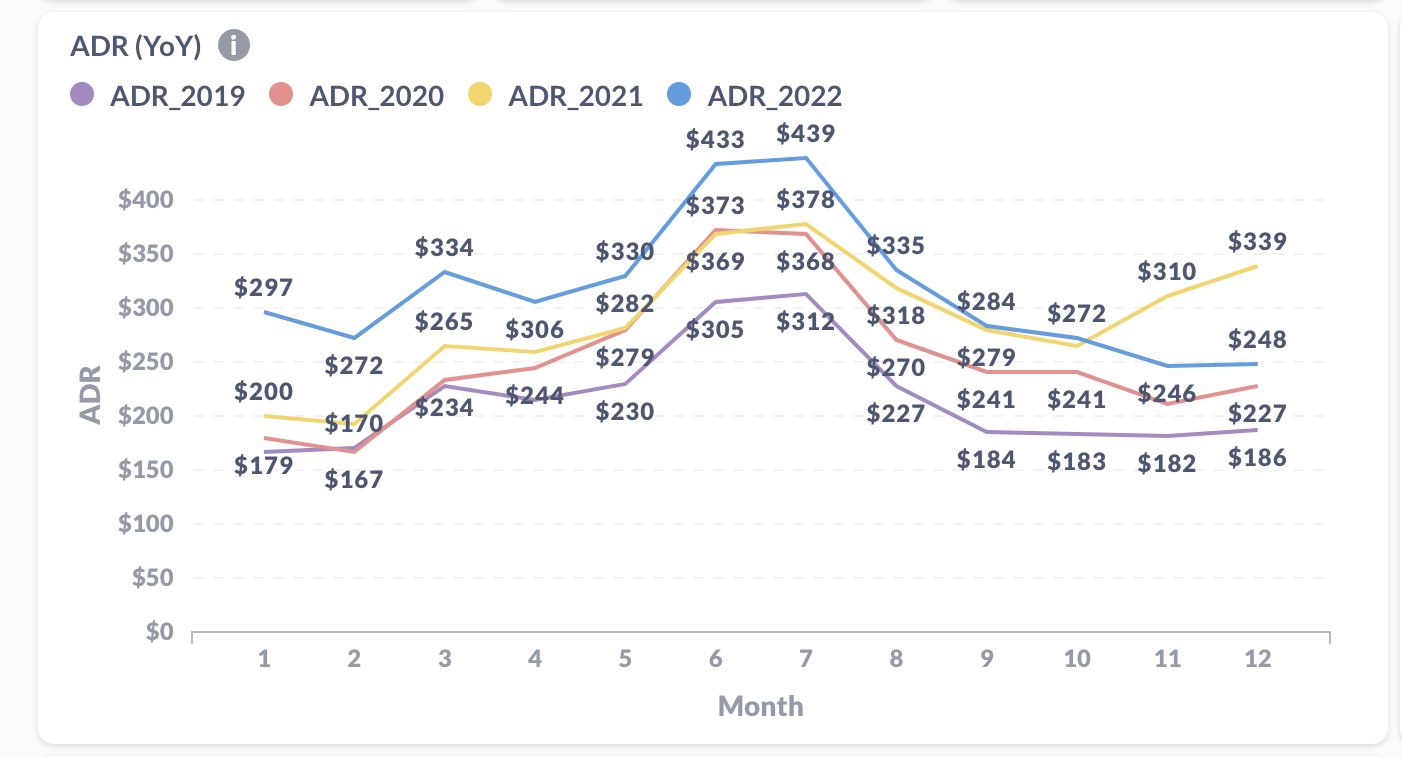
- ADR ‘22/’23 overview — Available daily rate showcases the prices of properties rented
- LOS ‘22/’23 overview — Average length of stay in a selected market. This is good to now, e.g. People stay an average of (x) days on these periods in time period (z)–you can see how this may have evolved since 2023
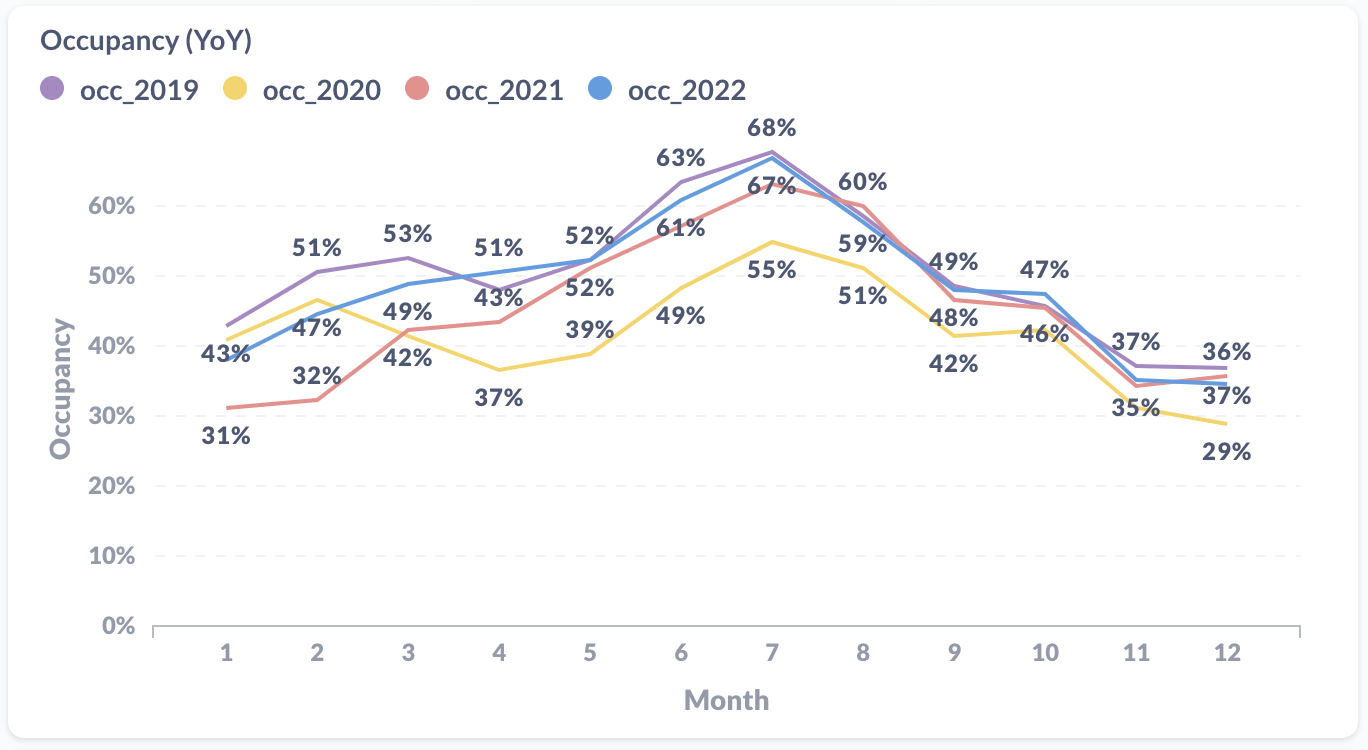
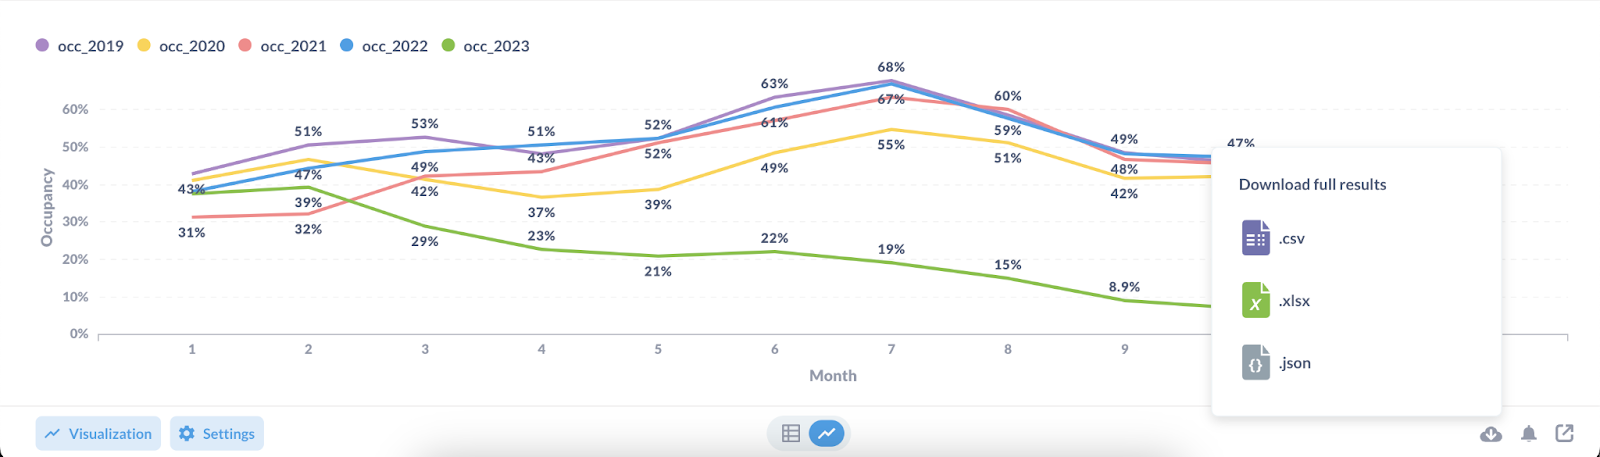
- Occupancy ‘22/’23 overview — estimated % of reserved nights out of a total number of available nights in your market.
- RevPar ‘22/’23 overview — Calculation of your market’s Revenue Per Available Rental, based on ADR multiplied by occupancy (ADR x Occ%). Hence you get you the quickest overview of the evolution of return in your market
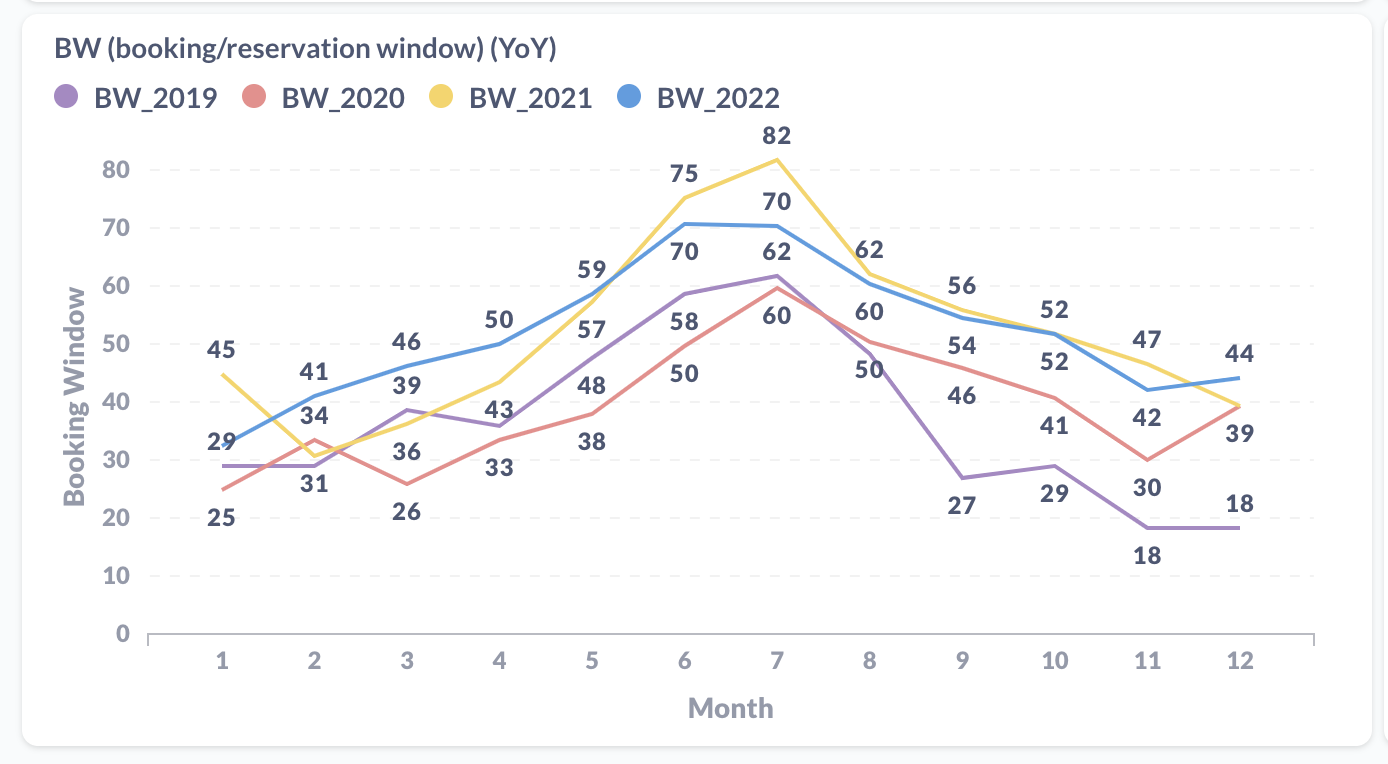
- Booking window ‘22/’23 overview — Comparison of number of days that guests are booking in advance. And so you can spot trends and inform your pricing strategy
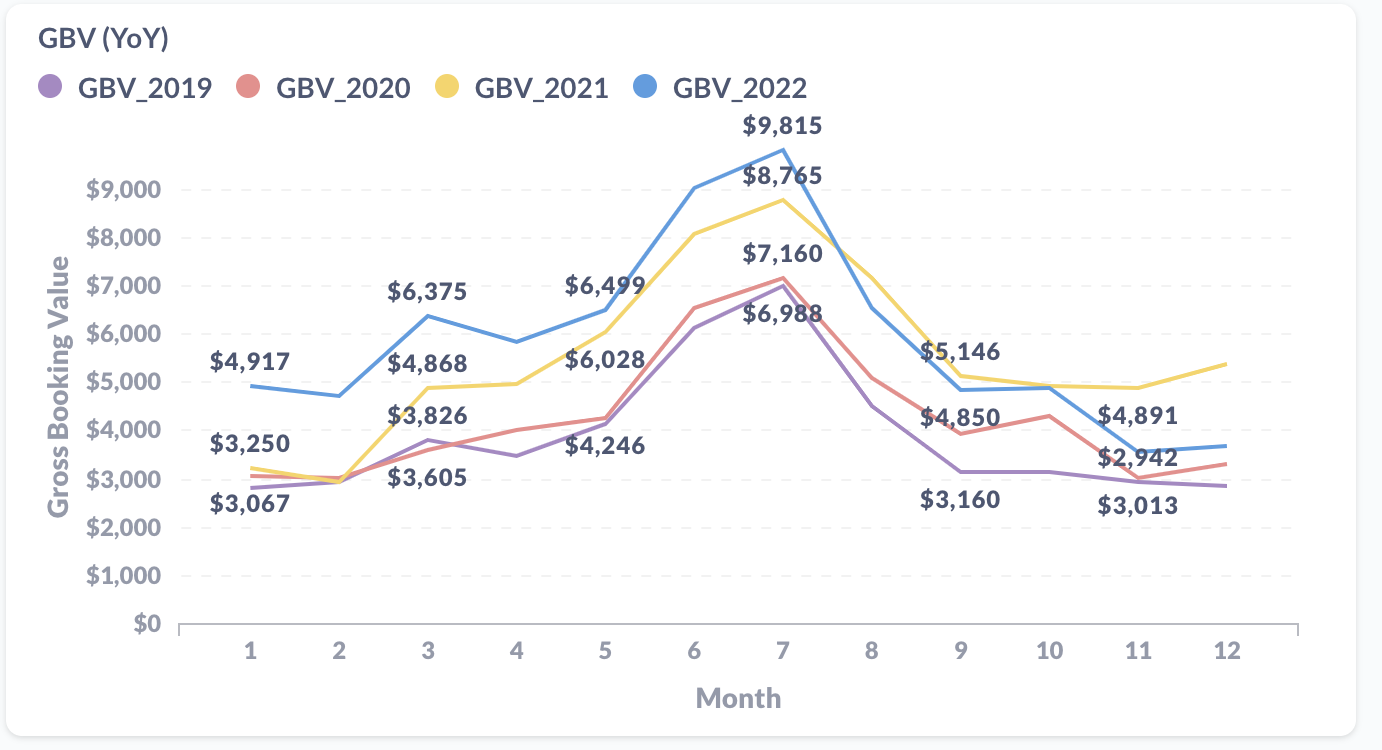
- Gross Booking Value ‘22/’23 overview — full amount of payments/ total revenue processed
Throughout the dashboard, data covers 2019, ‘20, ‘21, ‘22 and soon 2023 for each metric, giving you a consolidated and bright visualisation of:
- ADR evolution, to spectate the seasonal and yearly increase and decrease of rate in your market:
- Occupancy evolution, to see the seasonality and trends of your whole professional field, allowing you to compare trends in different segments of your competition or market.
- Your market’s RevPAR metrics, which allow you to analyse your two most important metrics at the same time, seeing the occupancy and ADR performance combined in one graph:

- Length of stay preferences of visitors to your market - seeing trends in customer behaviour, or evolution of the area into a more short term or midterm rental, which often happens with fast developing business districts or alternatively, resorts and vacation rentals:

- Booking window (lead time) progression, allowing you to see how the area’s sustainability and demand is rising or decreasing over each year through the seasons:
- GBV of your area and your competition at the scale of each month and year to analyse the revenue potential of the market:
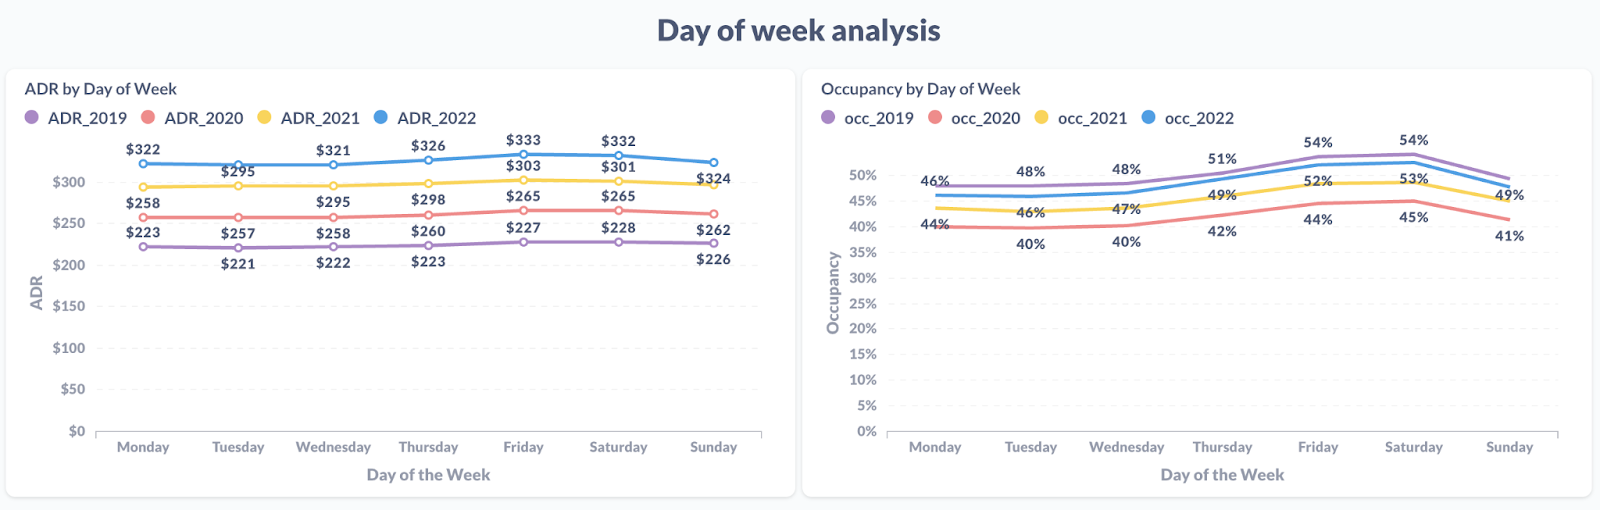
- Finally, a day-of-week analysis, which helps you to understand and correlate the pricing and occupancy of each day, rising or decreasing year over year:
Key benefits
Our Market Performance template is a turn-key solution for a couple of reasons. It provides:
- X-ray of your professional area at the glance
- Set in place YoY comparisons from 2019 until now for historical trend analysis
- Every day of week metrics, such as ADR and occupancy
- Essential filtering capabilities selecting areas, amenities, subtypes and more
- Vastly customisable presets that can be tailored to your needs
- Totally exportable information in one click for external analysis
Who is this dashboard for?
Market Performance is a constructive starting point for anyone who is engaged with revenue management in the vacation rental market, or wishing to understand their area performance better. Especially:
- Revenue managers — for valuable metrics which support business decisions based on real-time data, allowing maximal efficiency of pricing strategies, renting policies and guest retention in specific segments.
- Property managers — helps to focus on strategic demand trends, and better understand their competitive set, as well as providing useful benchmarks.
- Marketing managers — whose ability to transparently tailor marketing strategies, based on YoY performance trends.
- Real Estate investors — for whom knowledge of the area and its year-over-year metrics would help to understand return on investment of properties proposed or acquired.
Pain points resolved
- All functional market metrics in one place.
- Easy to understand and interpret data.
- Clear market segmentation and comparison.
- Easy-export tool with multiple use-case scenarios (understanding subtype ADR, analysing market seasonality, comparing year-over-year, to name a few).
- Tracking the market fidelity by setting the automatic email reporting.
What’s included
- Market supply and demand with thorough filtering abilities.
- Essential metrics: ADR, Occupancy, LOS, BW, RevPAR & Gross Booking Value.
- Year over Year comparison of each of the essentials for trend identification.
- Data back to 2019 for the essential market metrics
- Weekdays data for ADR and occupancy for each year