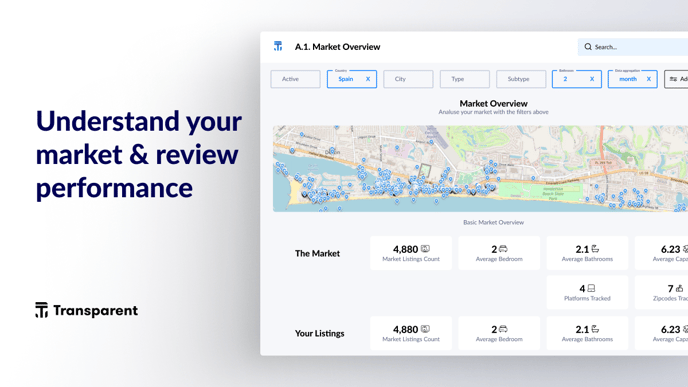
Market Overview is built to give you a snapshot understanding of your listings within your market, the evolution in short-term rentals, but also to provide analysis of your reviews and general metrics of the market
Numbers below are provided for an example market:
Market Overview 🔎
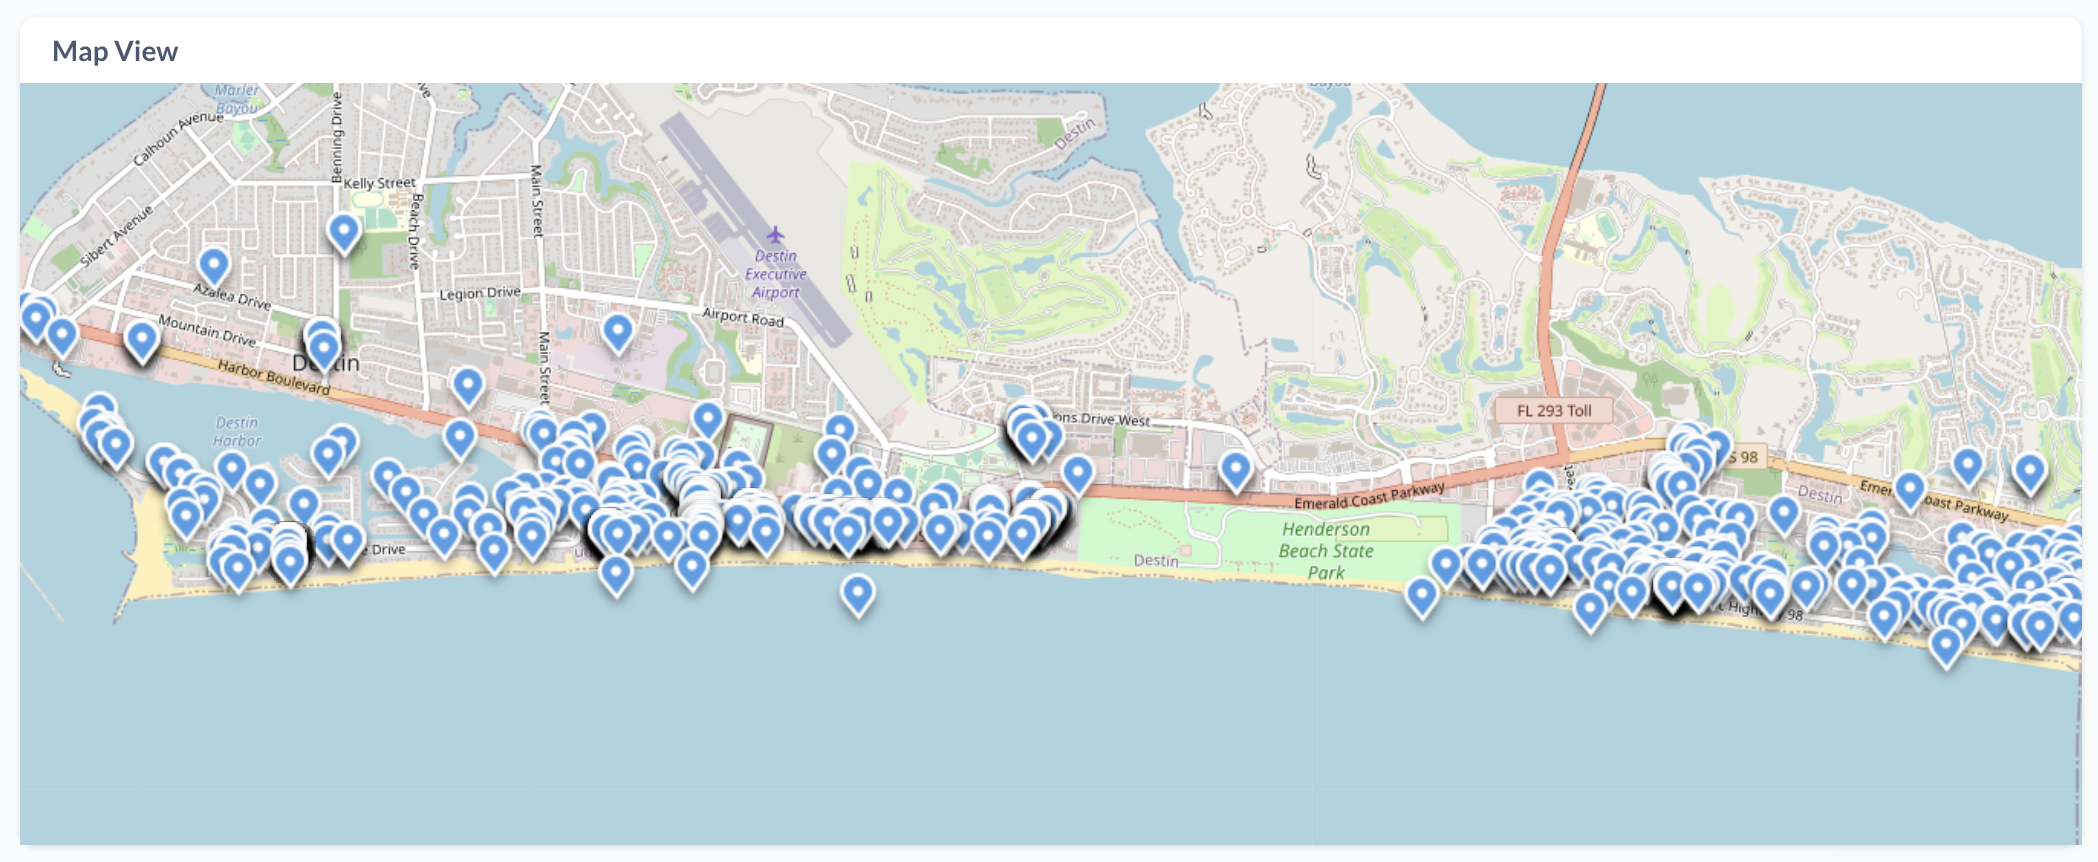
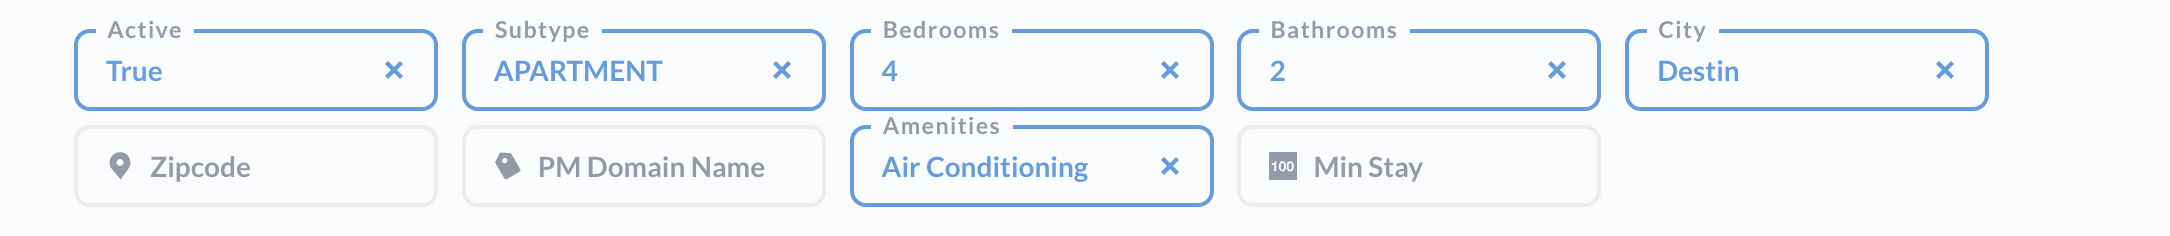
The A.1. Market Overview begins with a map overview of your market and default filters on top, gives you a bird-eye view of the area of your operation, density of the market supply and hot zones. Using filters on top of the dashboard, you can create any specific comp-set to see on the map, for example:
Active apartments of 4 bedrooms and 2 bathrooms in the Destin city with Air Conditioning:
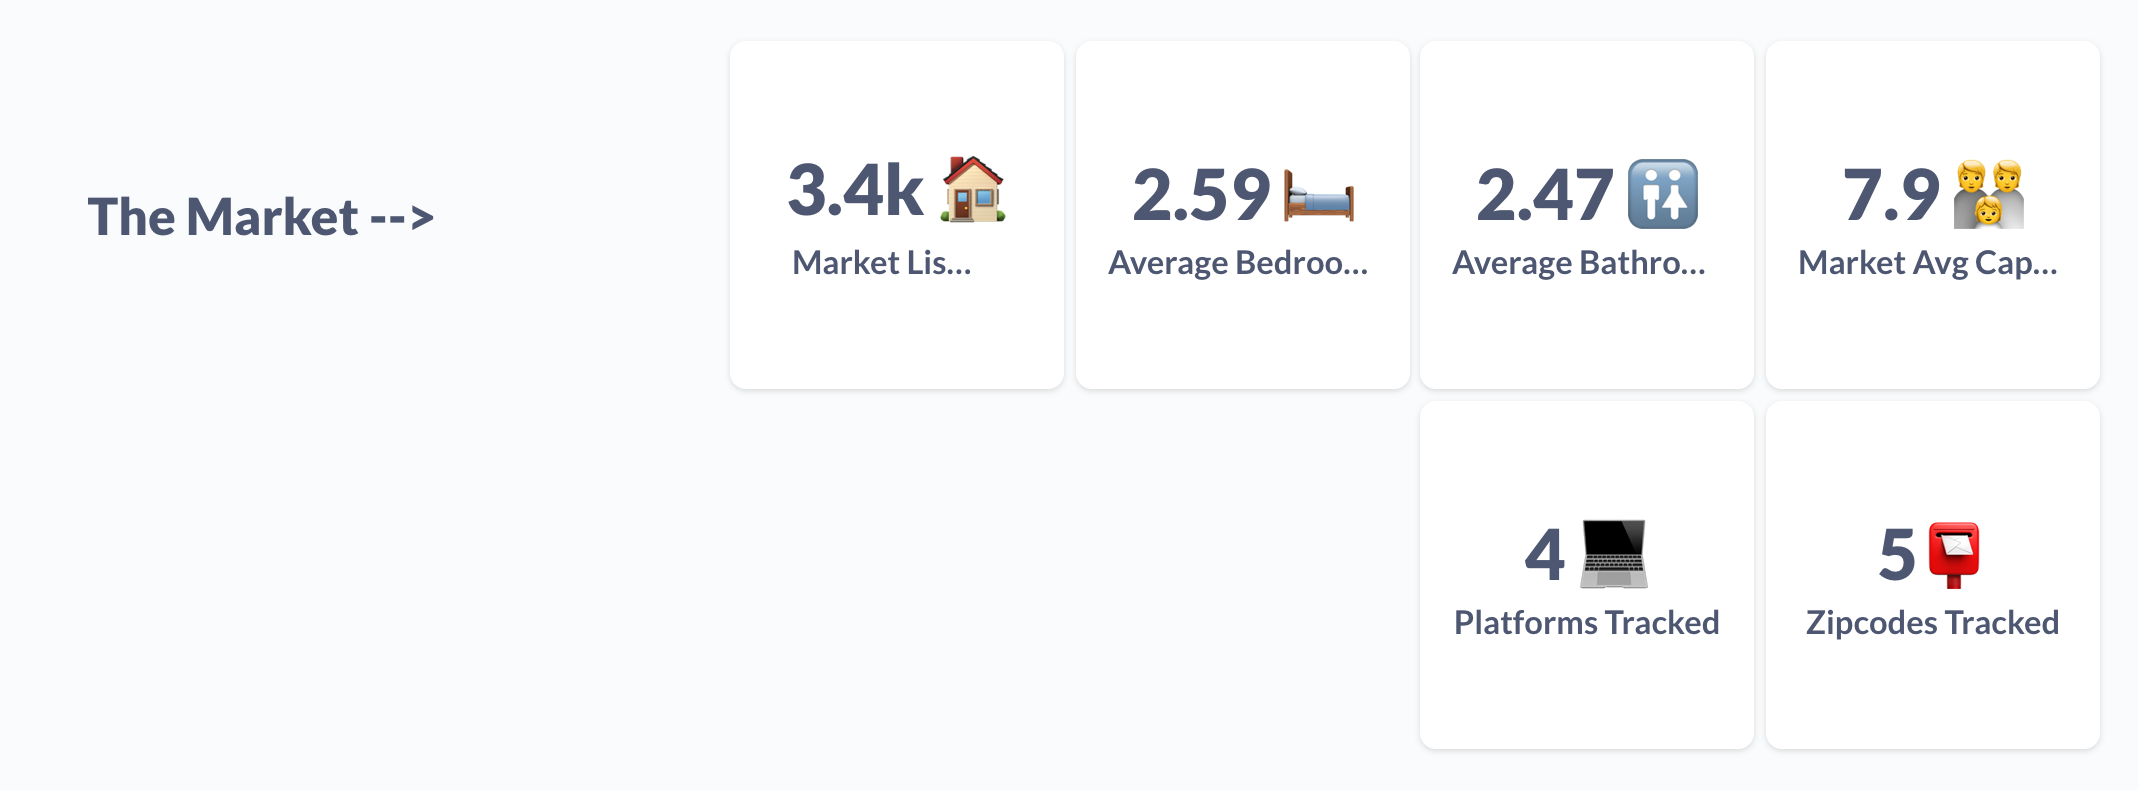
The next thing you'll see is the distribution of your chosen market and filters by number of listings, average of bedrooms, bathrooms, capacity, platforms and Zipcodes tracked:
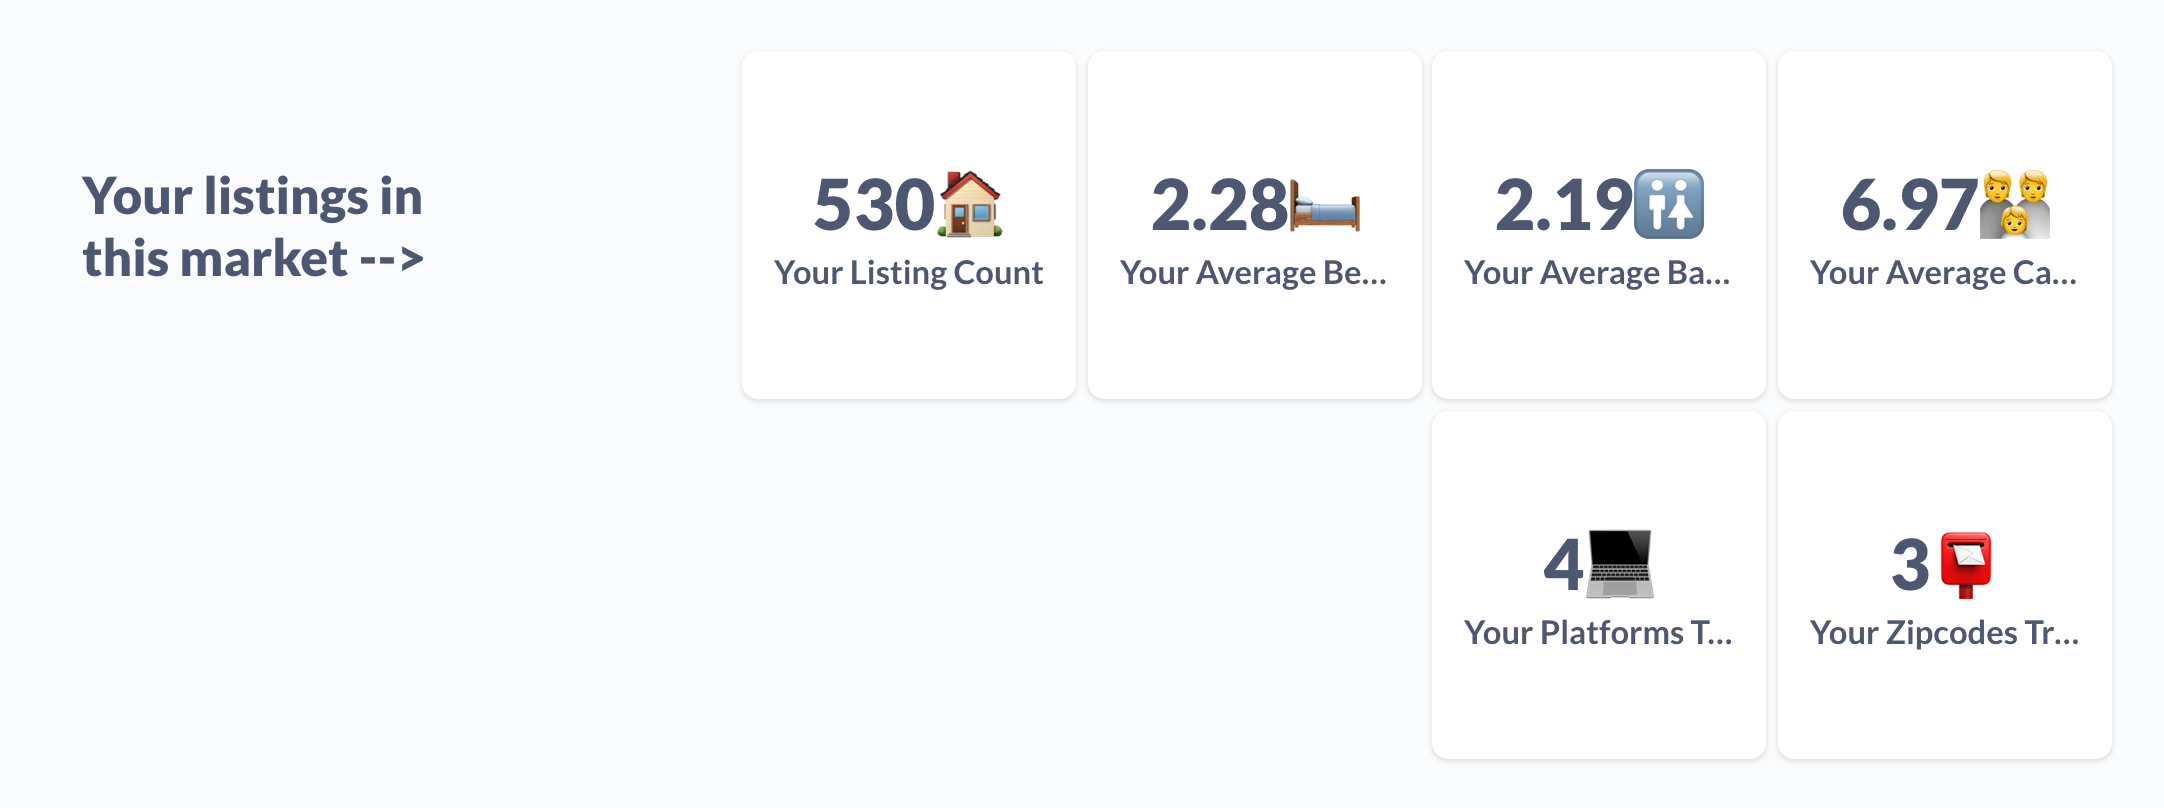
Same for your listings in the market:
The next one would be the stats of the of yours and market reviews performance with the count of the reviews first:

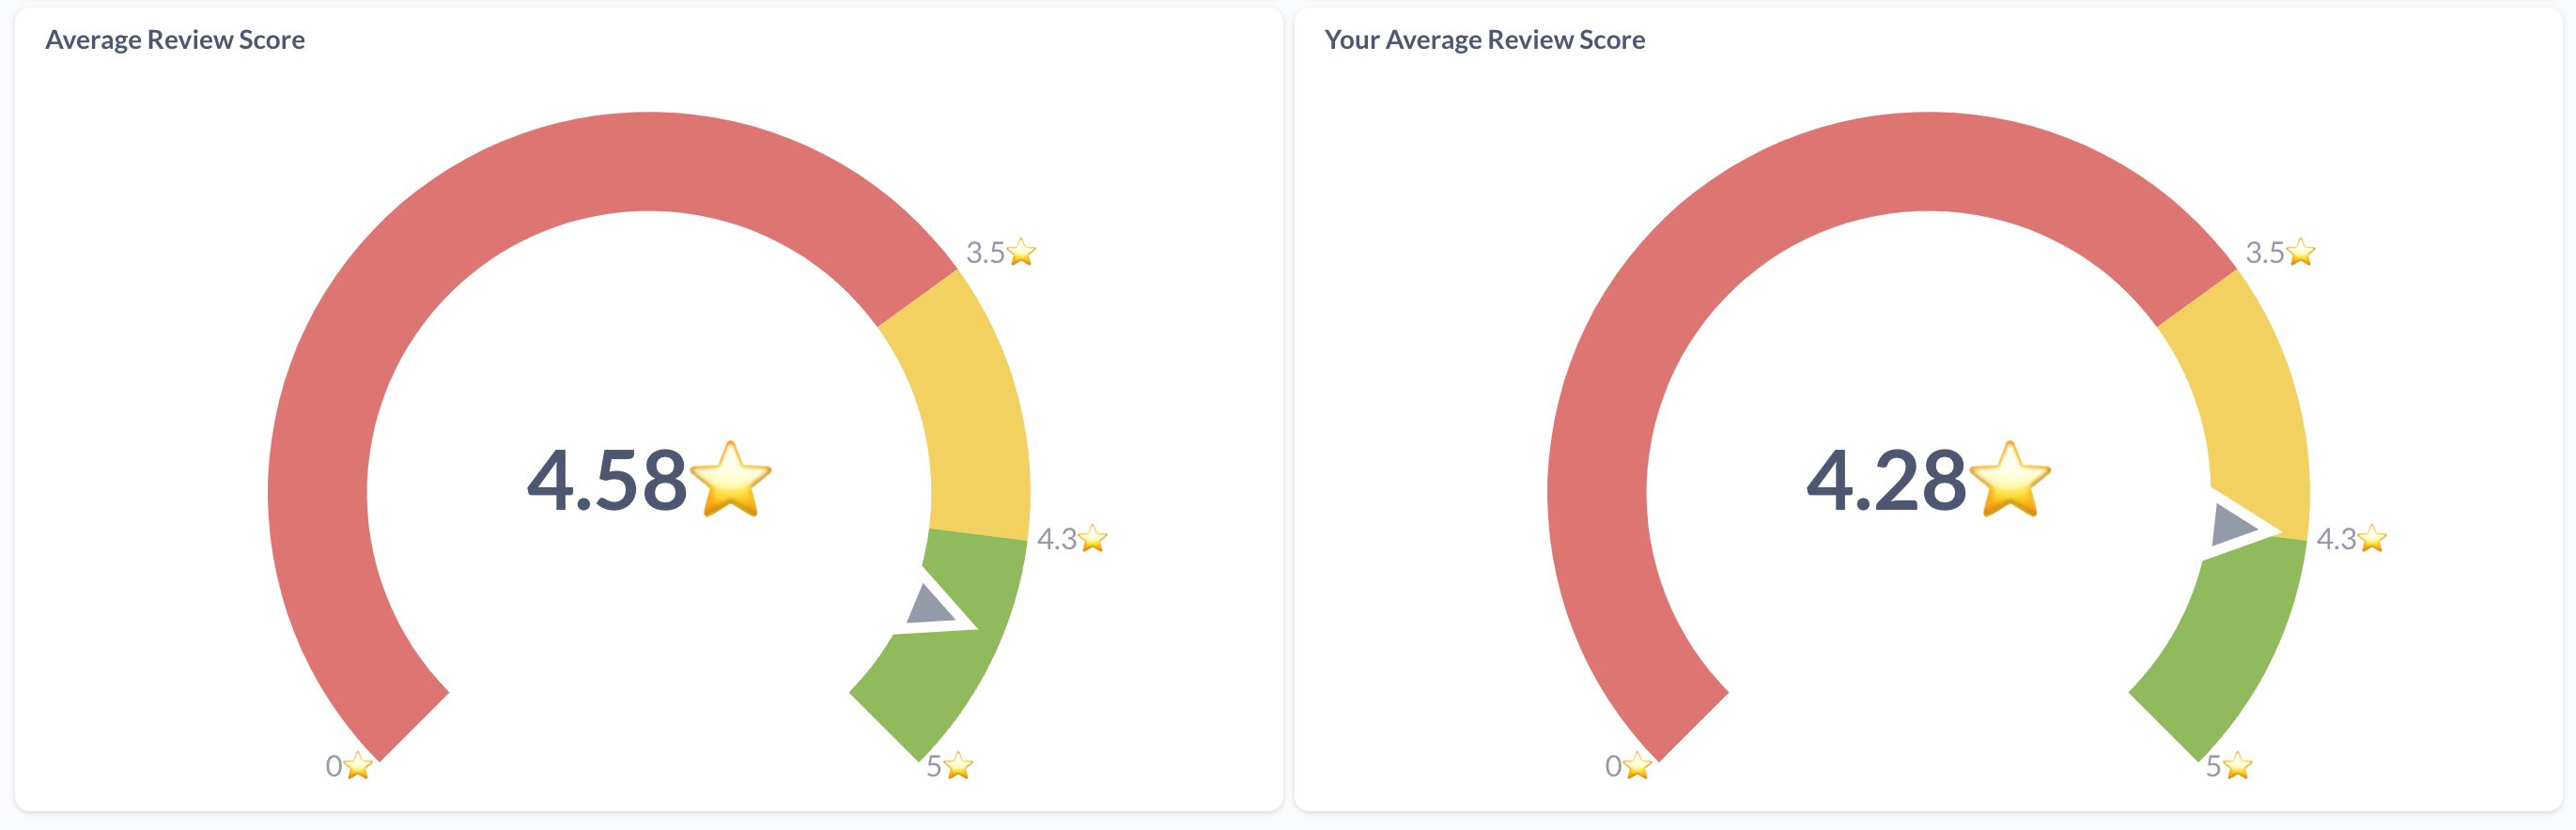
And the average reviews score below it:
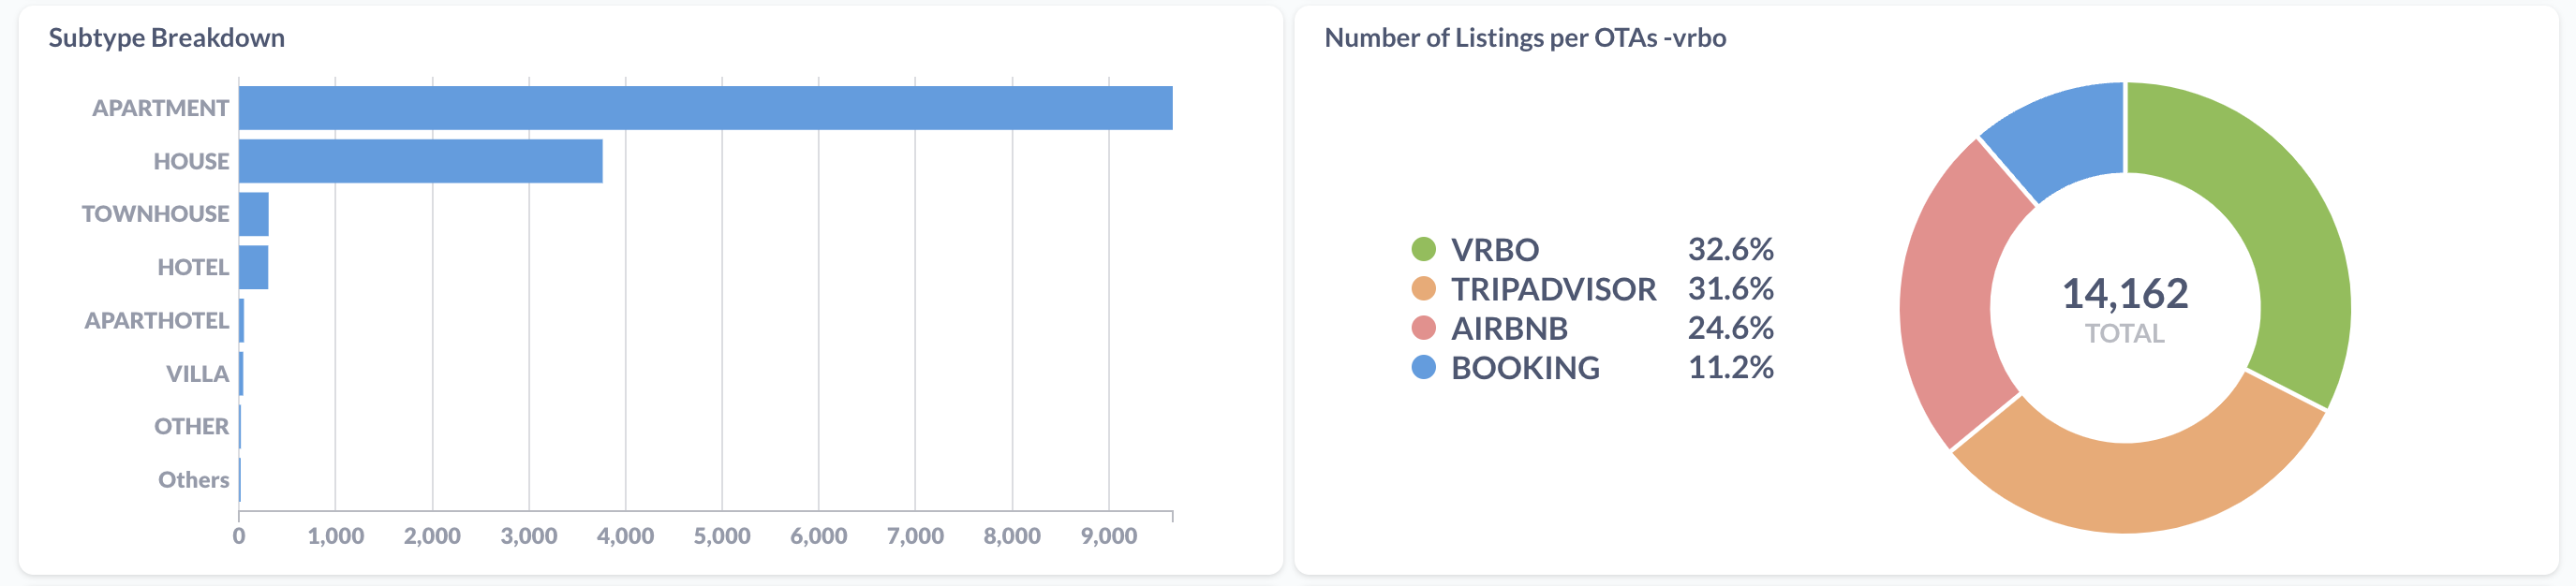
Market Breakdowns 🧩
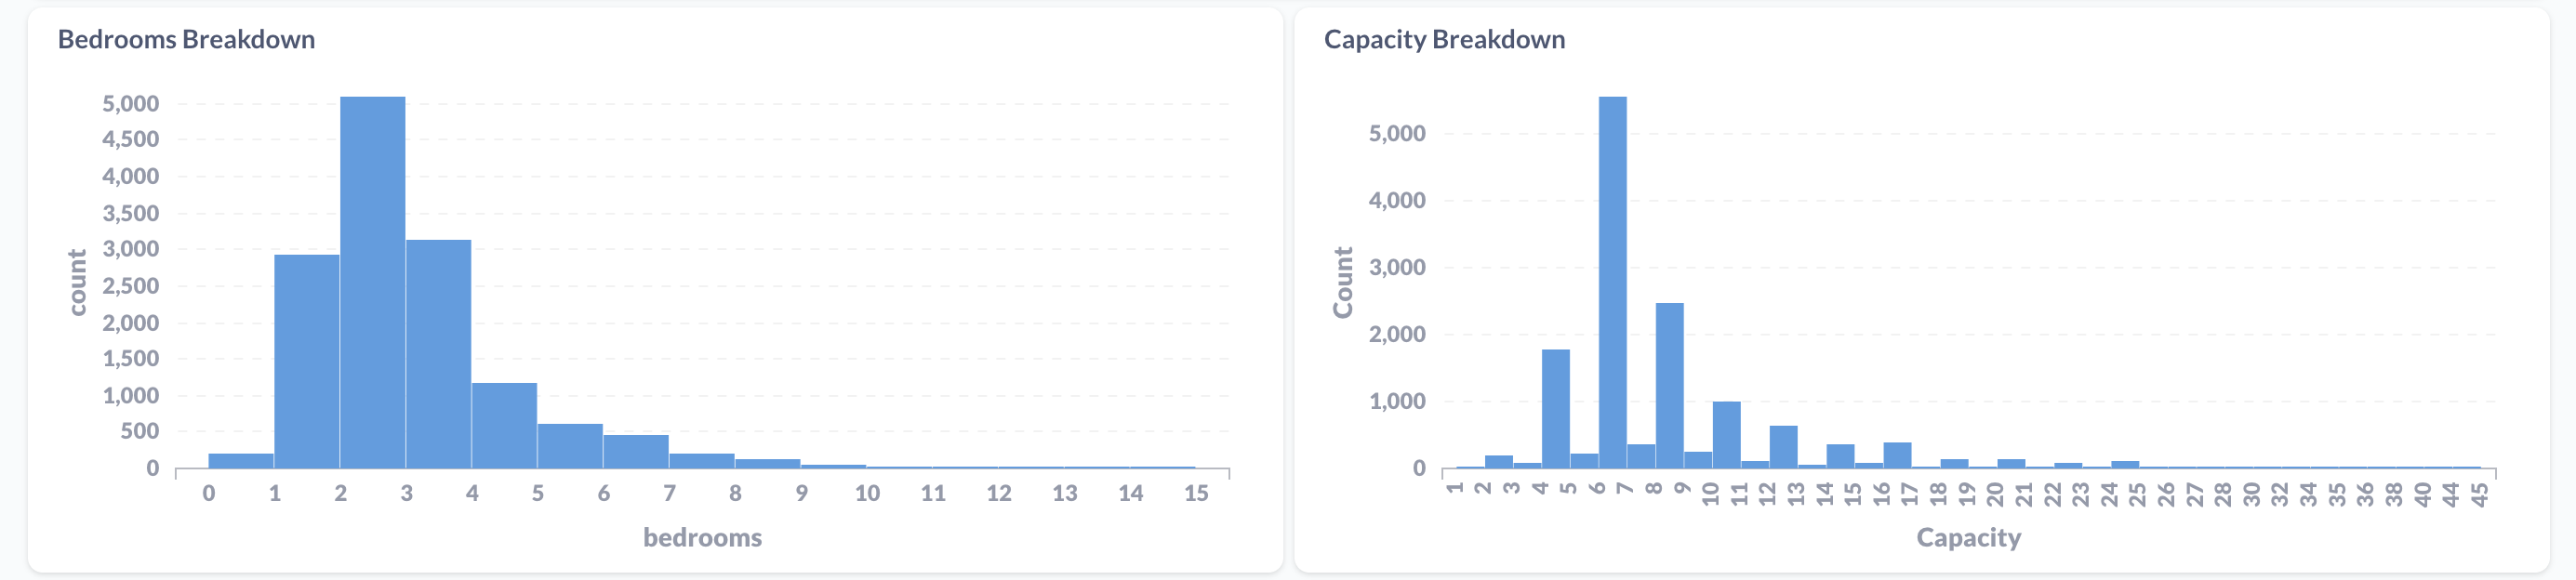
This is the part of the dashboard where you can see the market distribution of property accommodation properties broken down by the graphs. Please keep in mind that your properties are included in the metrics below.
Bedrooms and Capacity breakdown:
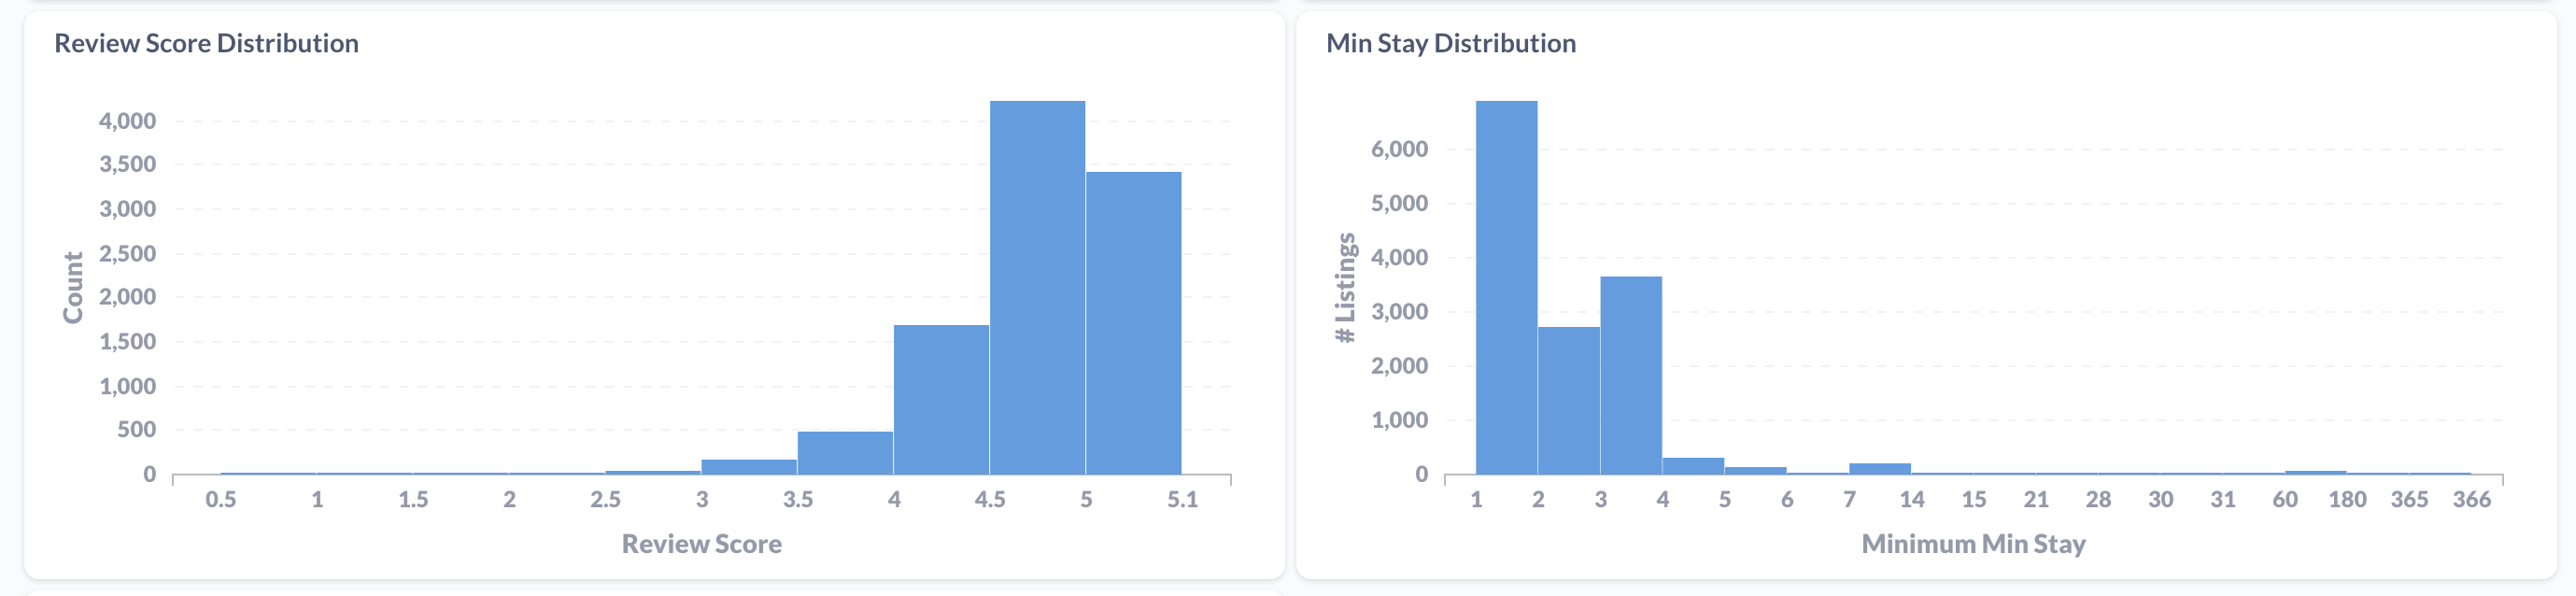
Review Score and Minimum Night stay distribution: